Sentiment Analysis of CHATGPT tweets
In this project, I perform the sentiment analysis of tweets about CHAT GPT from three months of data (Jan-Mar 2023).
Data
- The data for this project was taken from Kaggle.
- The tweets are not labelled with any sentiment in this data-set
Pre-processing
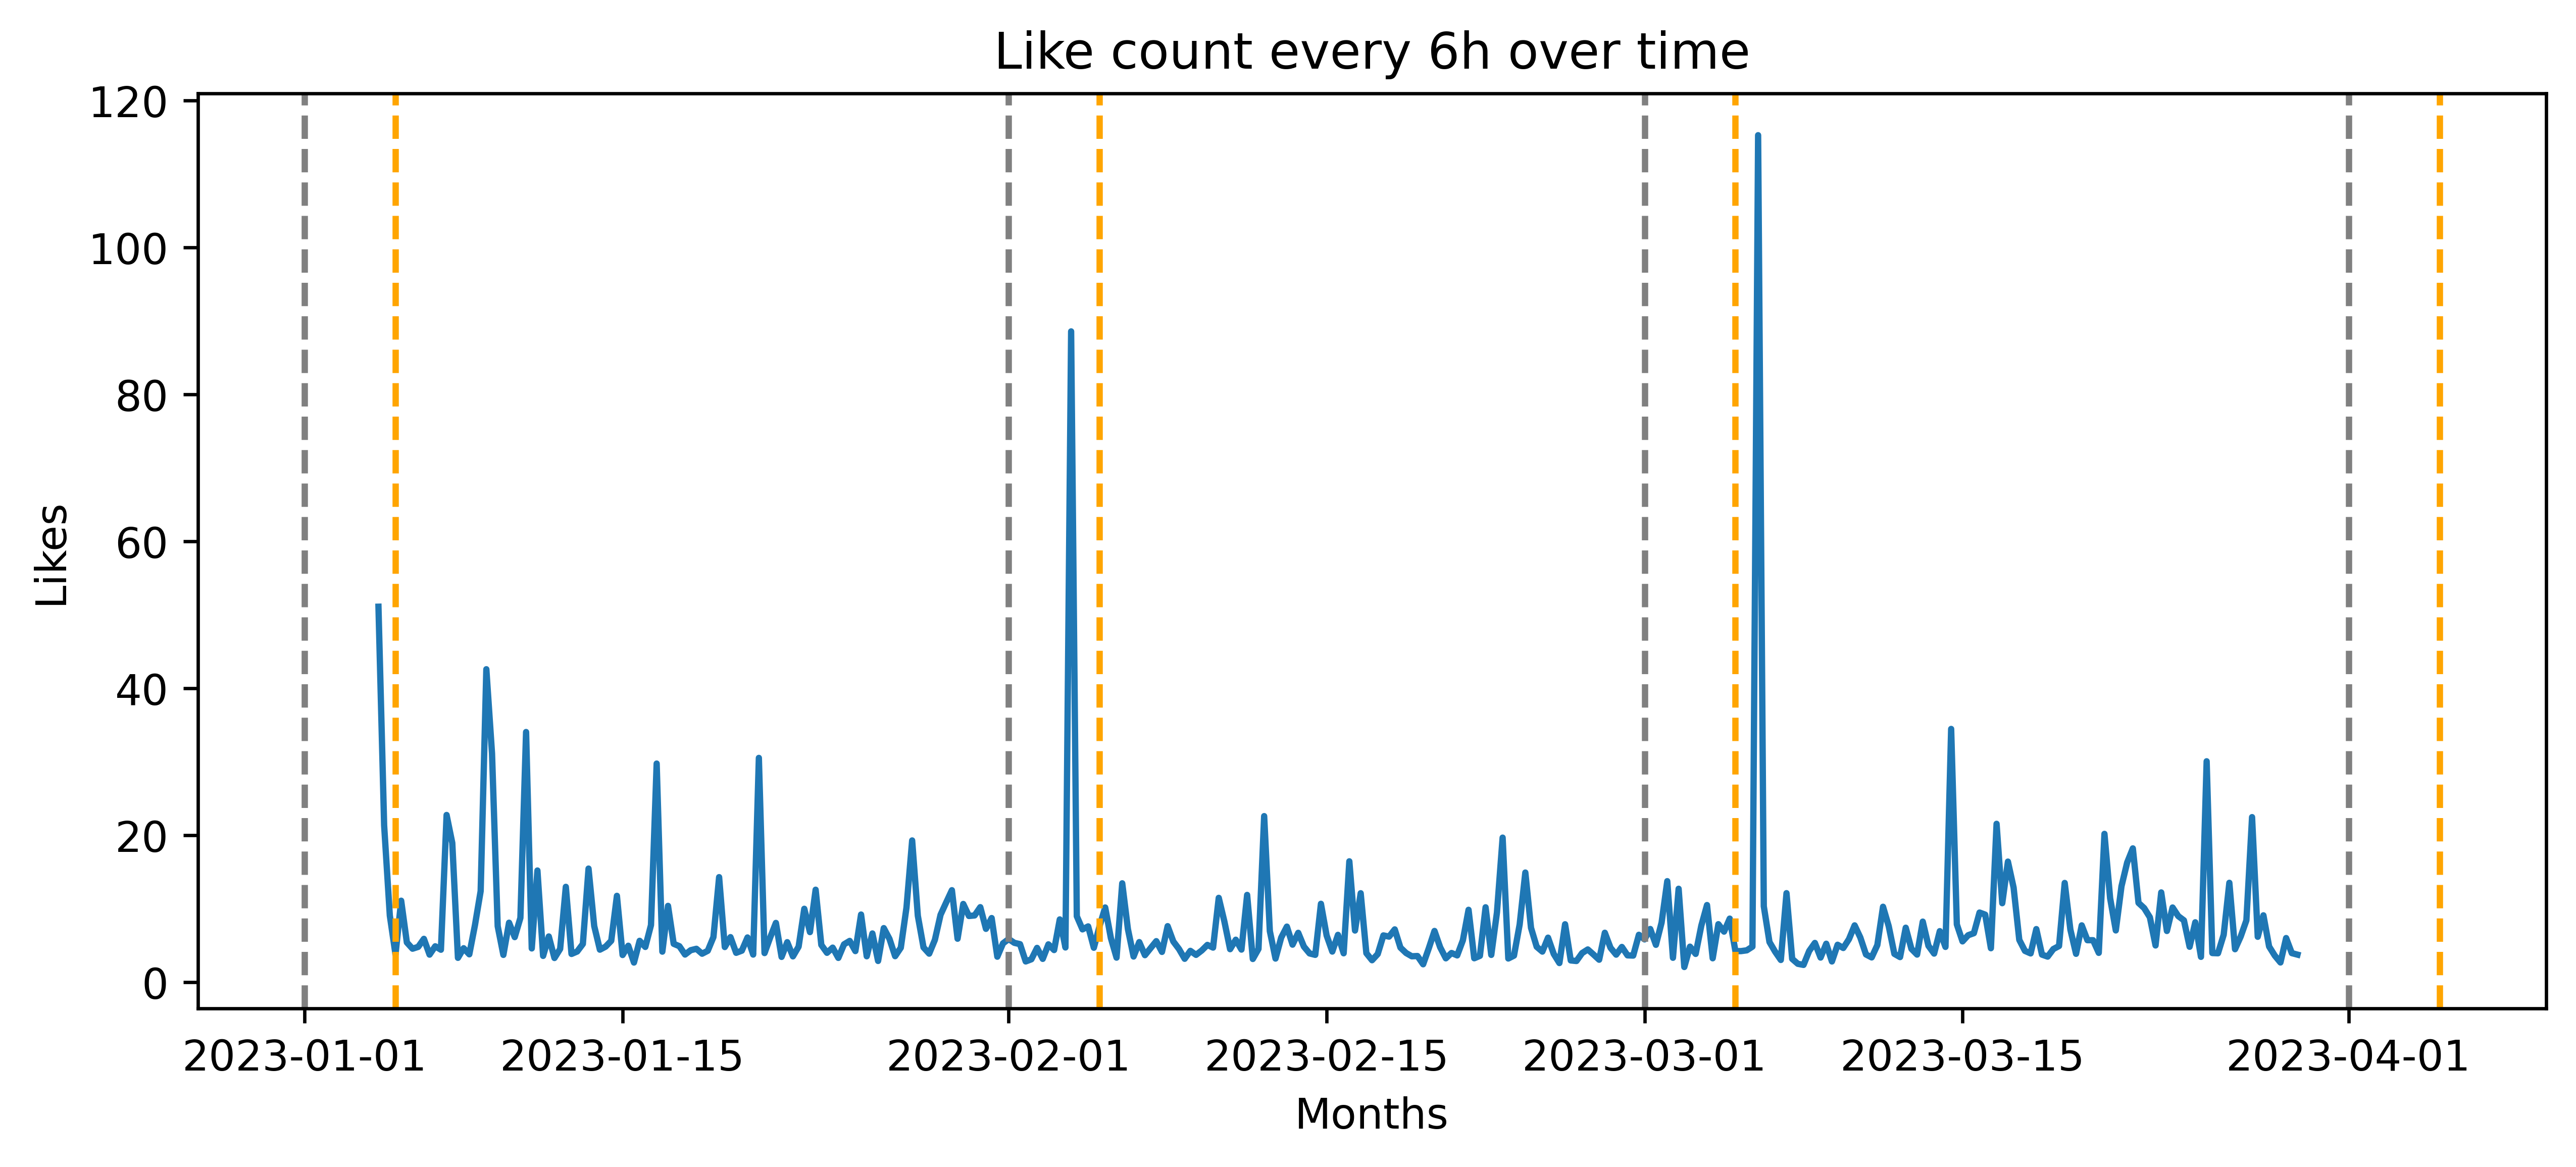
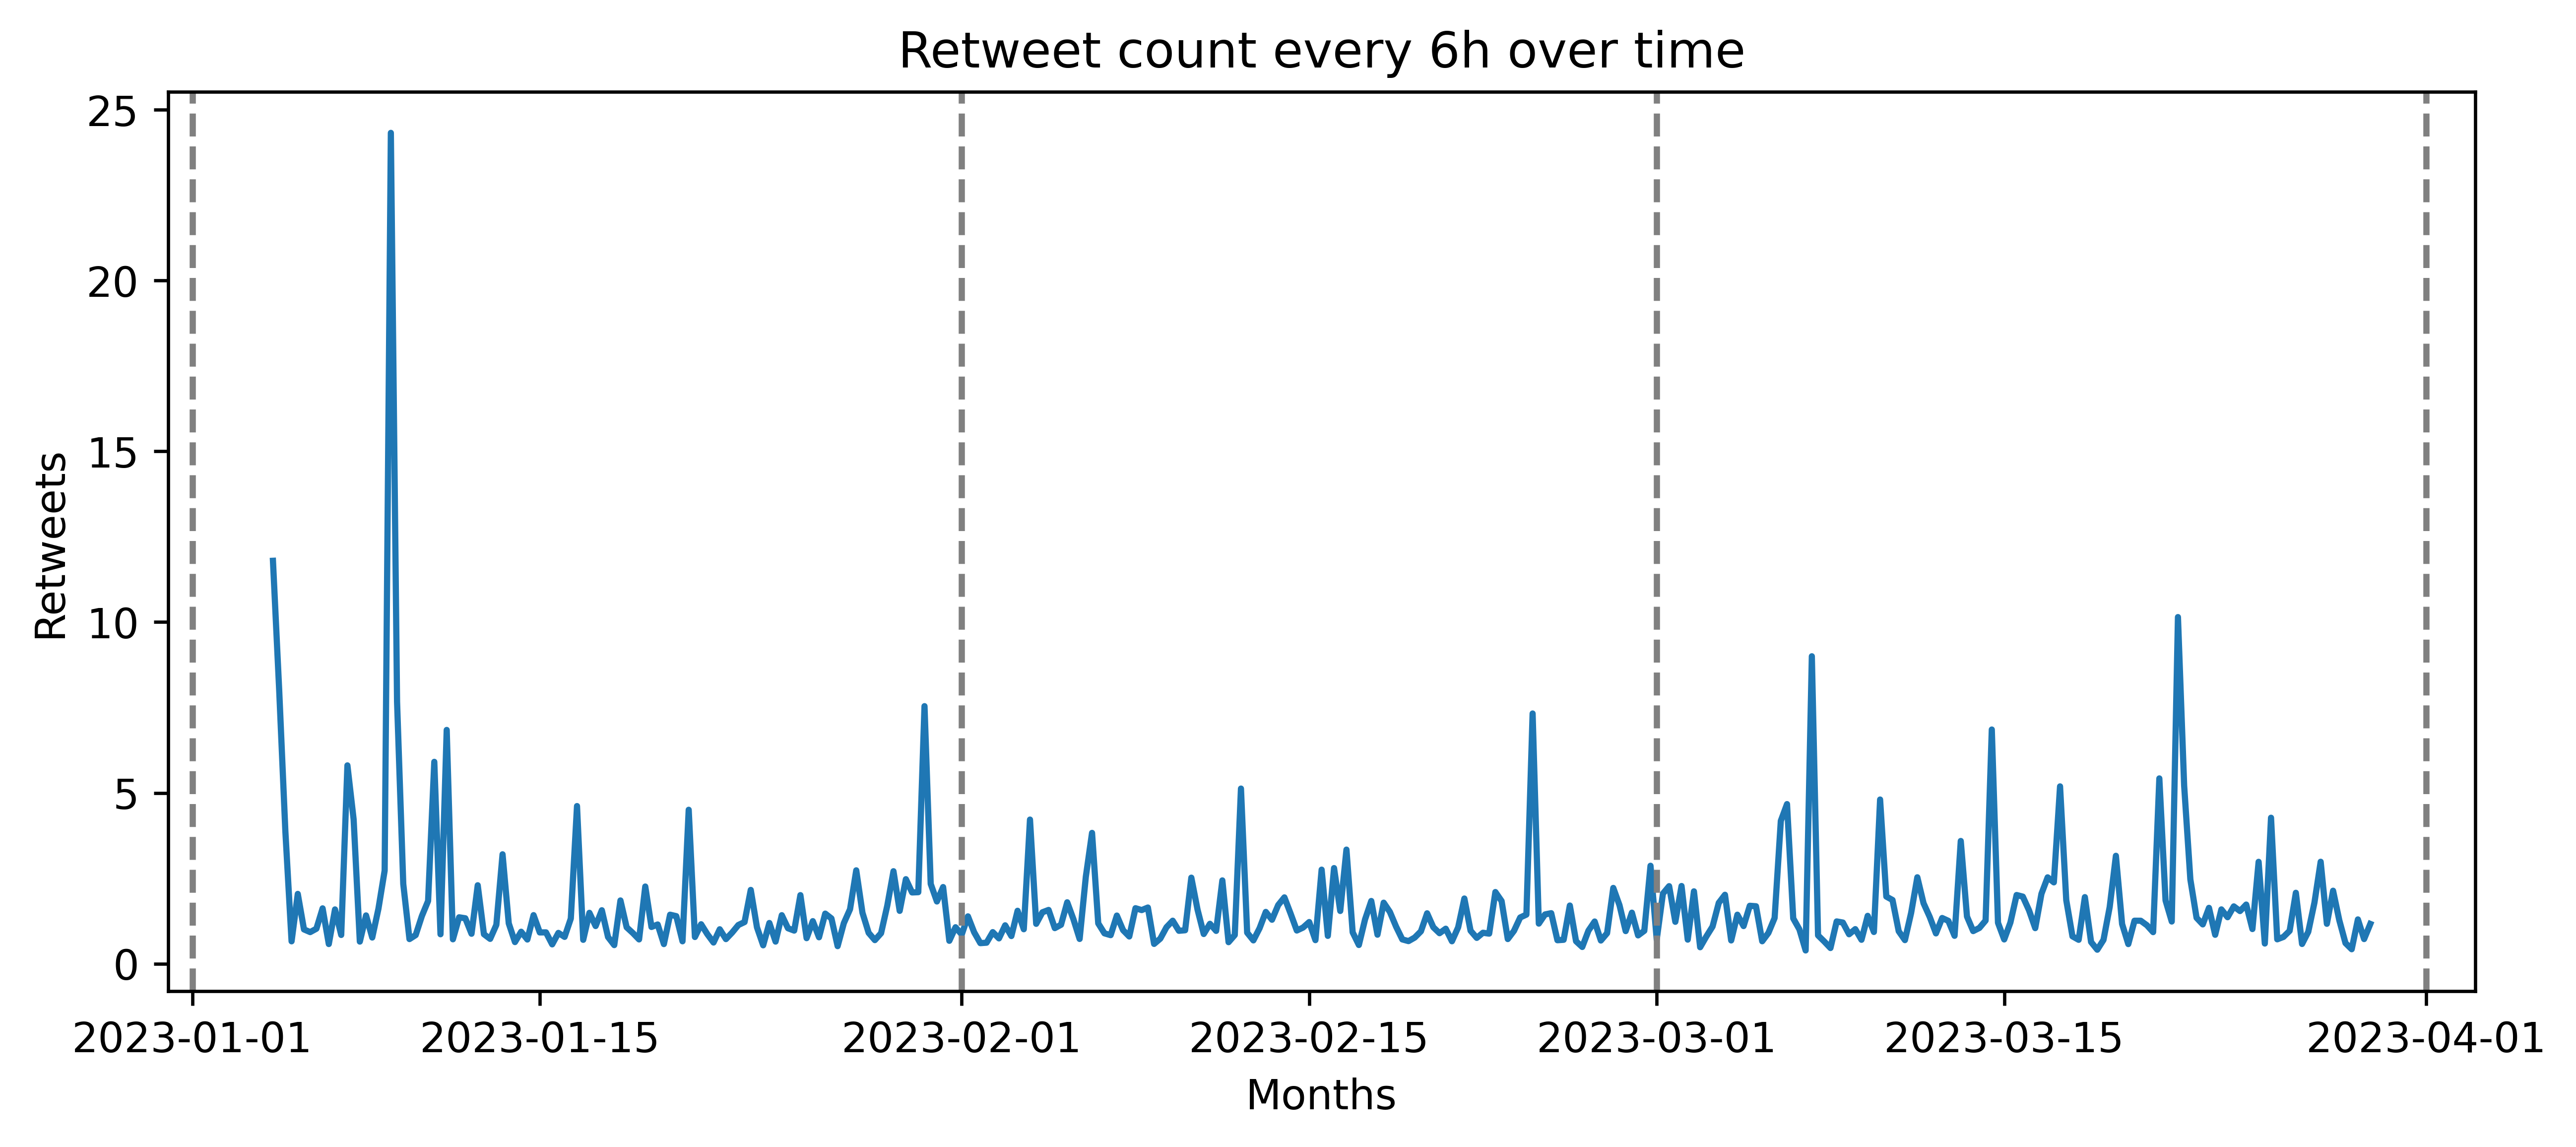
- The data was first checked for duplicates and missing values. Like and Retweet counts were evaluated over time (time-series-analysis is presented in a separate notebook on Github).
- Tokenized: to separate words from sentences
- Removed of any usernames (starting with @), and punctuations
- Passed through Lemmatization: to remove the inflections of the words
- Removed off rare-words and stop words
To clean each tweet, the content of the tweet was:
Polarity determination
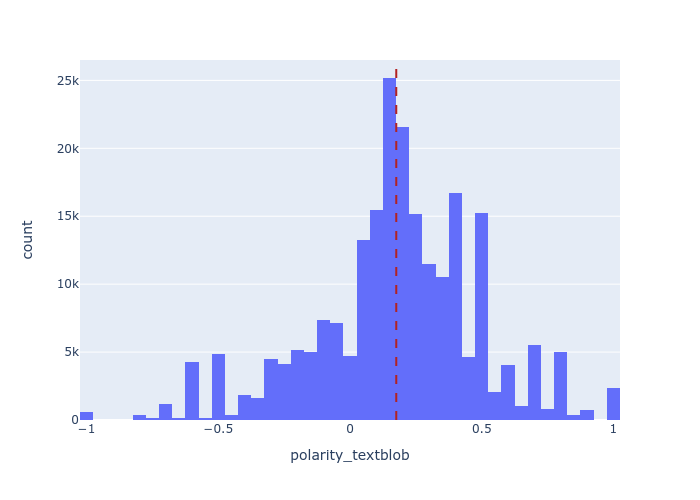
- TextBlob: I first executed POS (Part-of-Speech) tagging for each tweet, also done by separating each sentence from individual tweet. The adjectives from each tweet are then separated. The polarity is then calculated using TextBlob based on the adjectives of each tweet.
- Vader sentiment analysis: The content was cleaned but no punctuations were removed here such that the tool can read the sentiments accurately for each tweet. The polarity score was then calculated.
- To do a predictive analysis and train ML models, the data was split into test and training data.
- The training data was converted in a set of vectors using Count Vectorizer [or bag-of-words model]
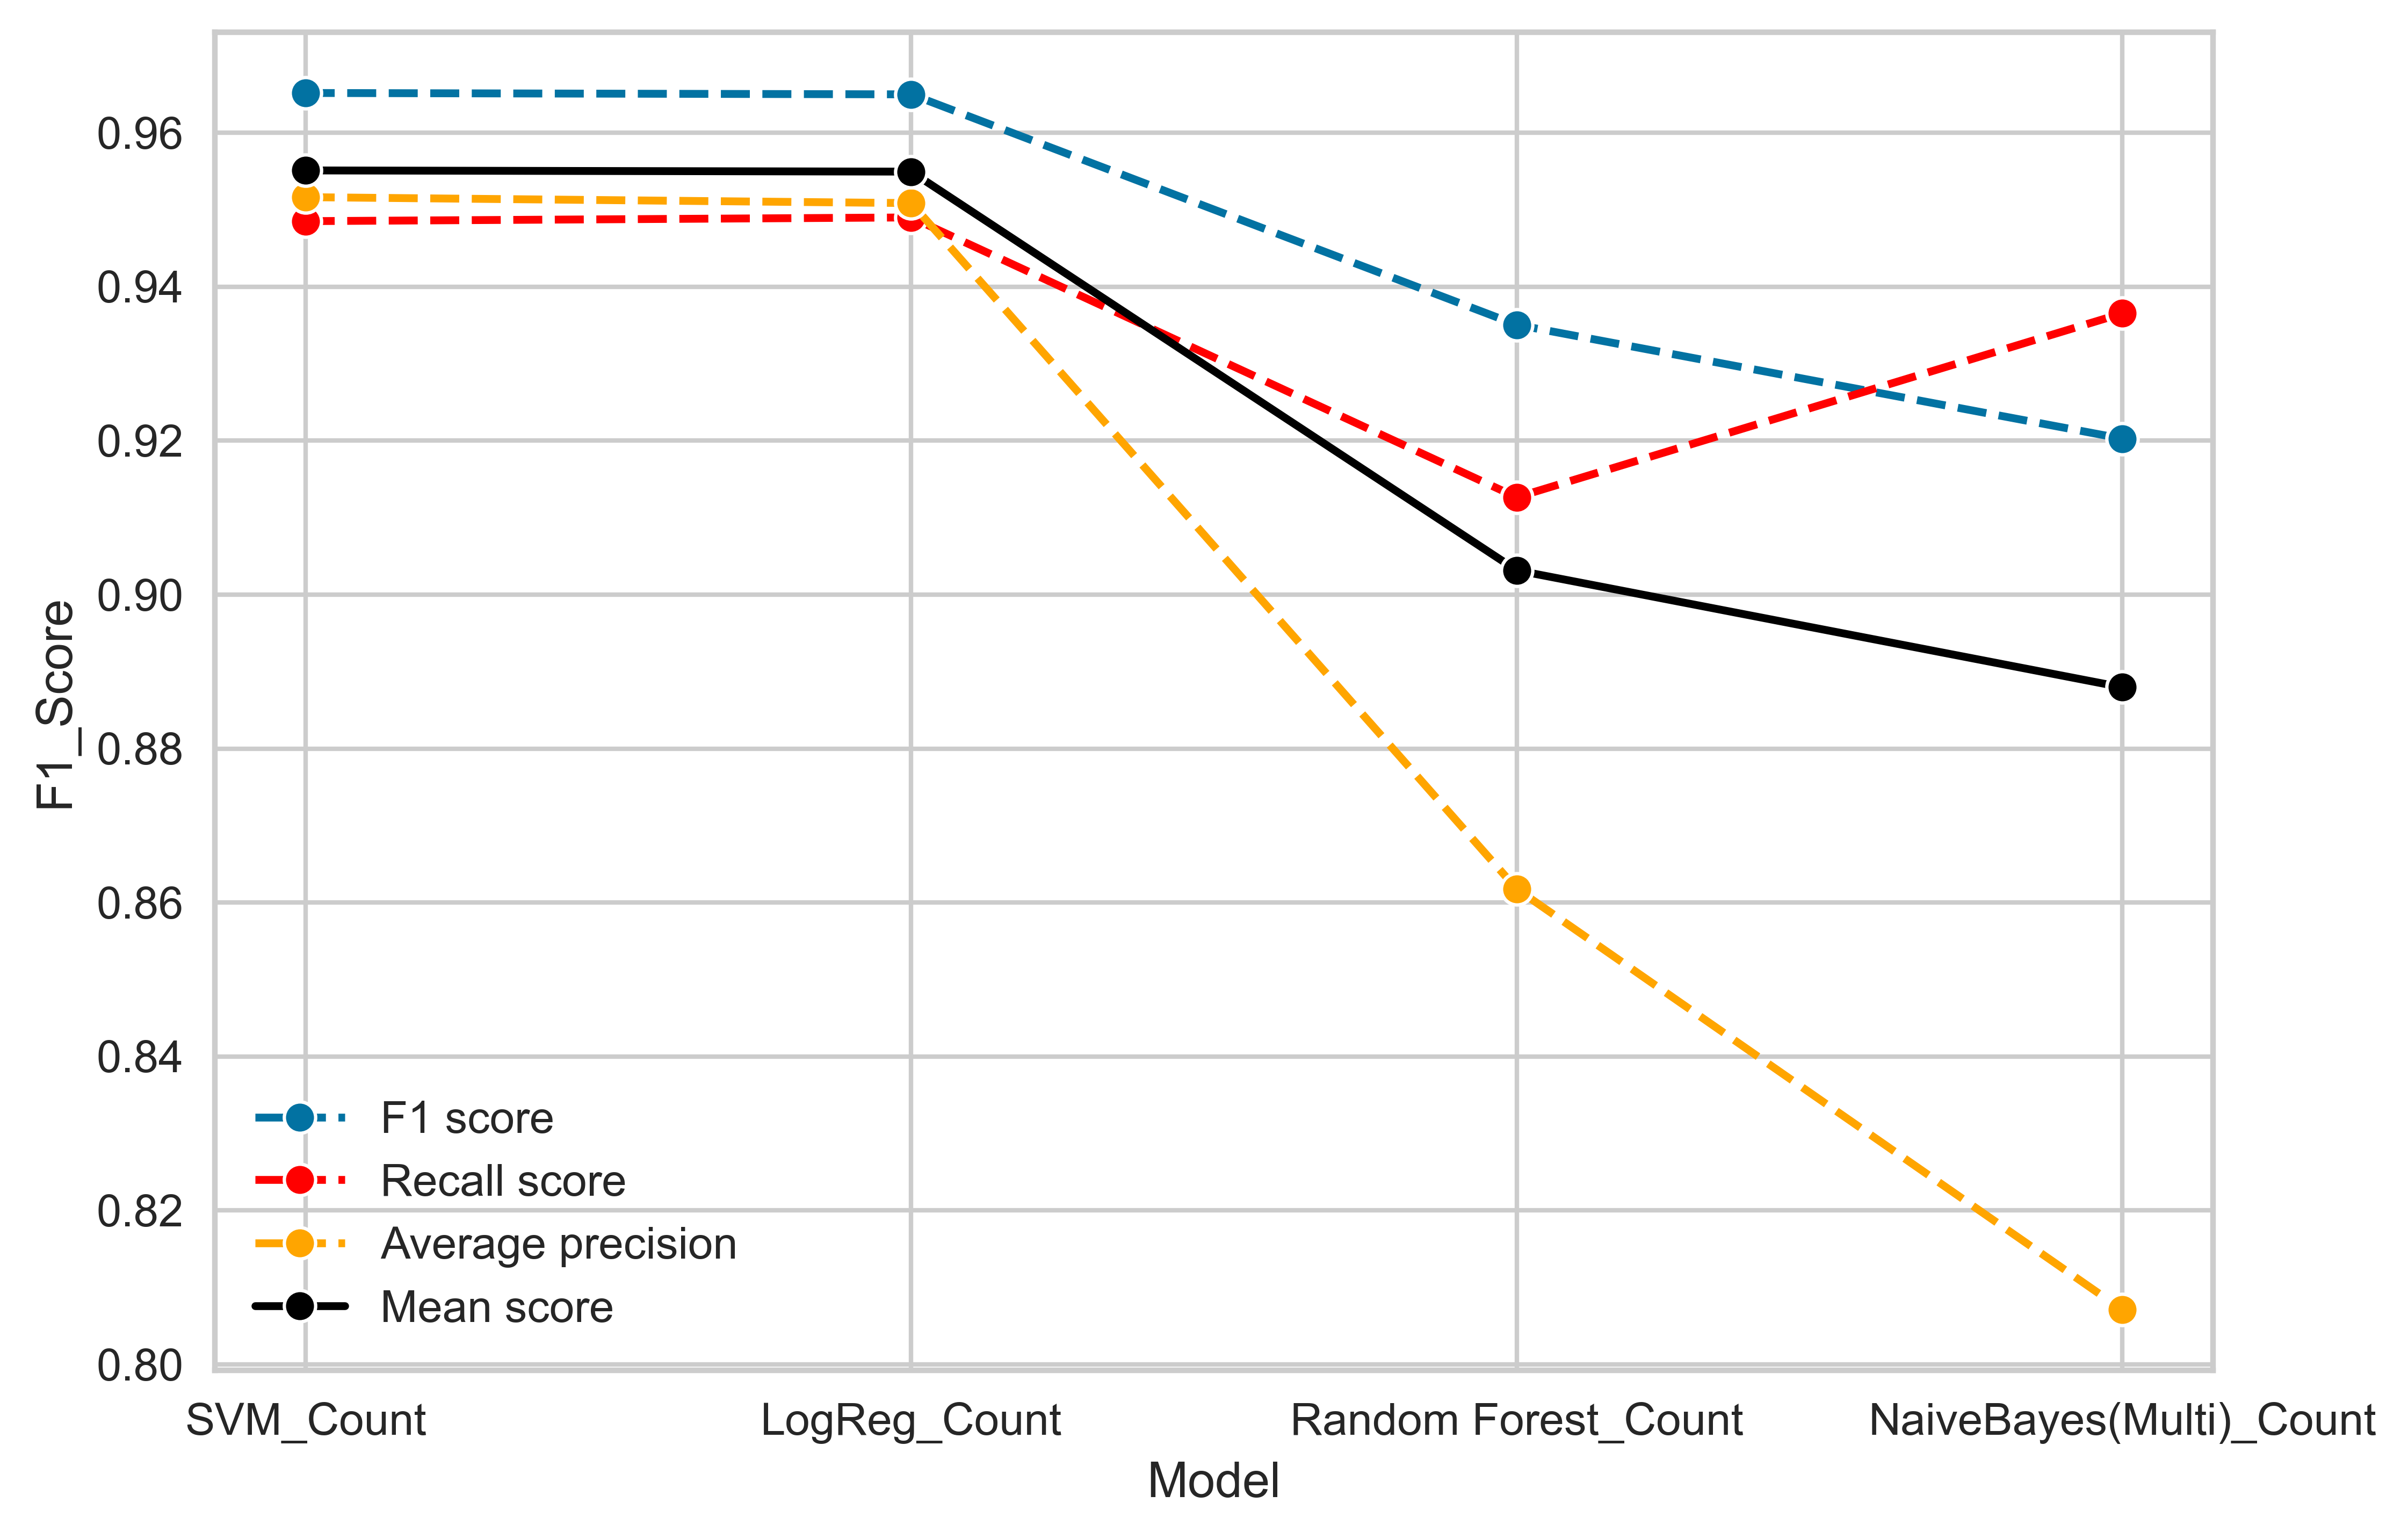
- This was then used to train four ML classification models: Logistical Regression, Multinomial Naive Bayes, Support Vector Machine (SVM), and Random Forest.
- K-Fold cross validation was performed on each model (with different metrics) with test data.
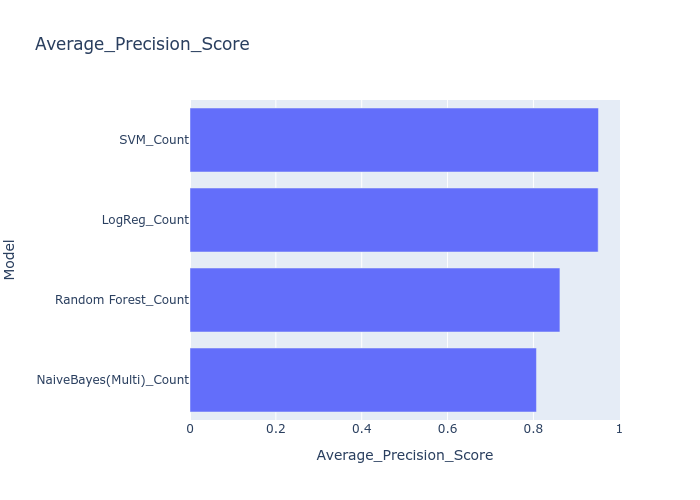
- F1 Score, Recall, and Average precision scores were calculated for the test data.
- The best perfoming model was SVM and Logistic Regression.
- Visualised the average scores for each of these models.
- Prediction for some sample tweets was performed using these models.
I determined the polarity and evaluated the sentiment score of each tweet from its content using two different tools: NLTK's TextBlob and VaderSentiment Analysis.
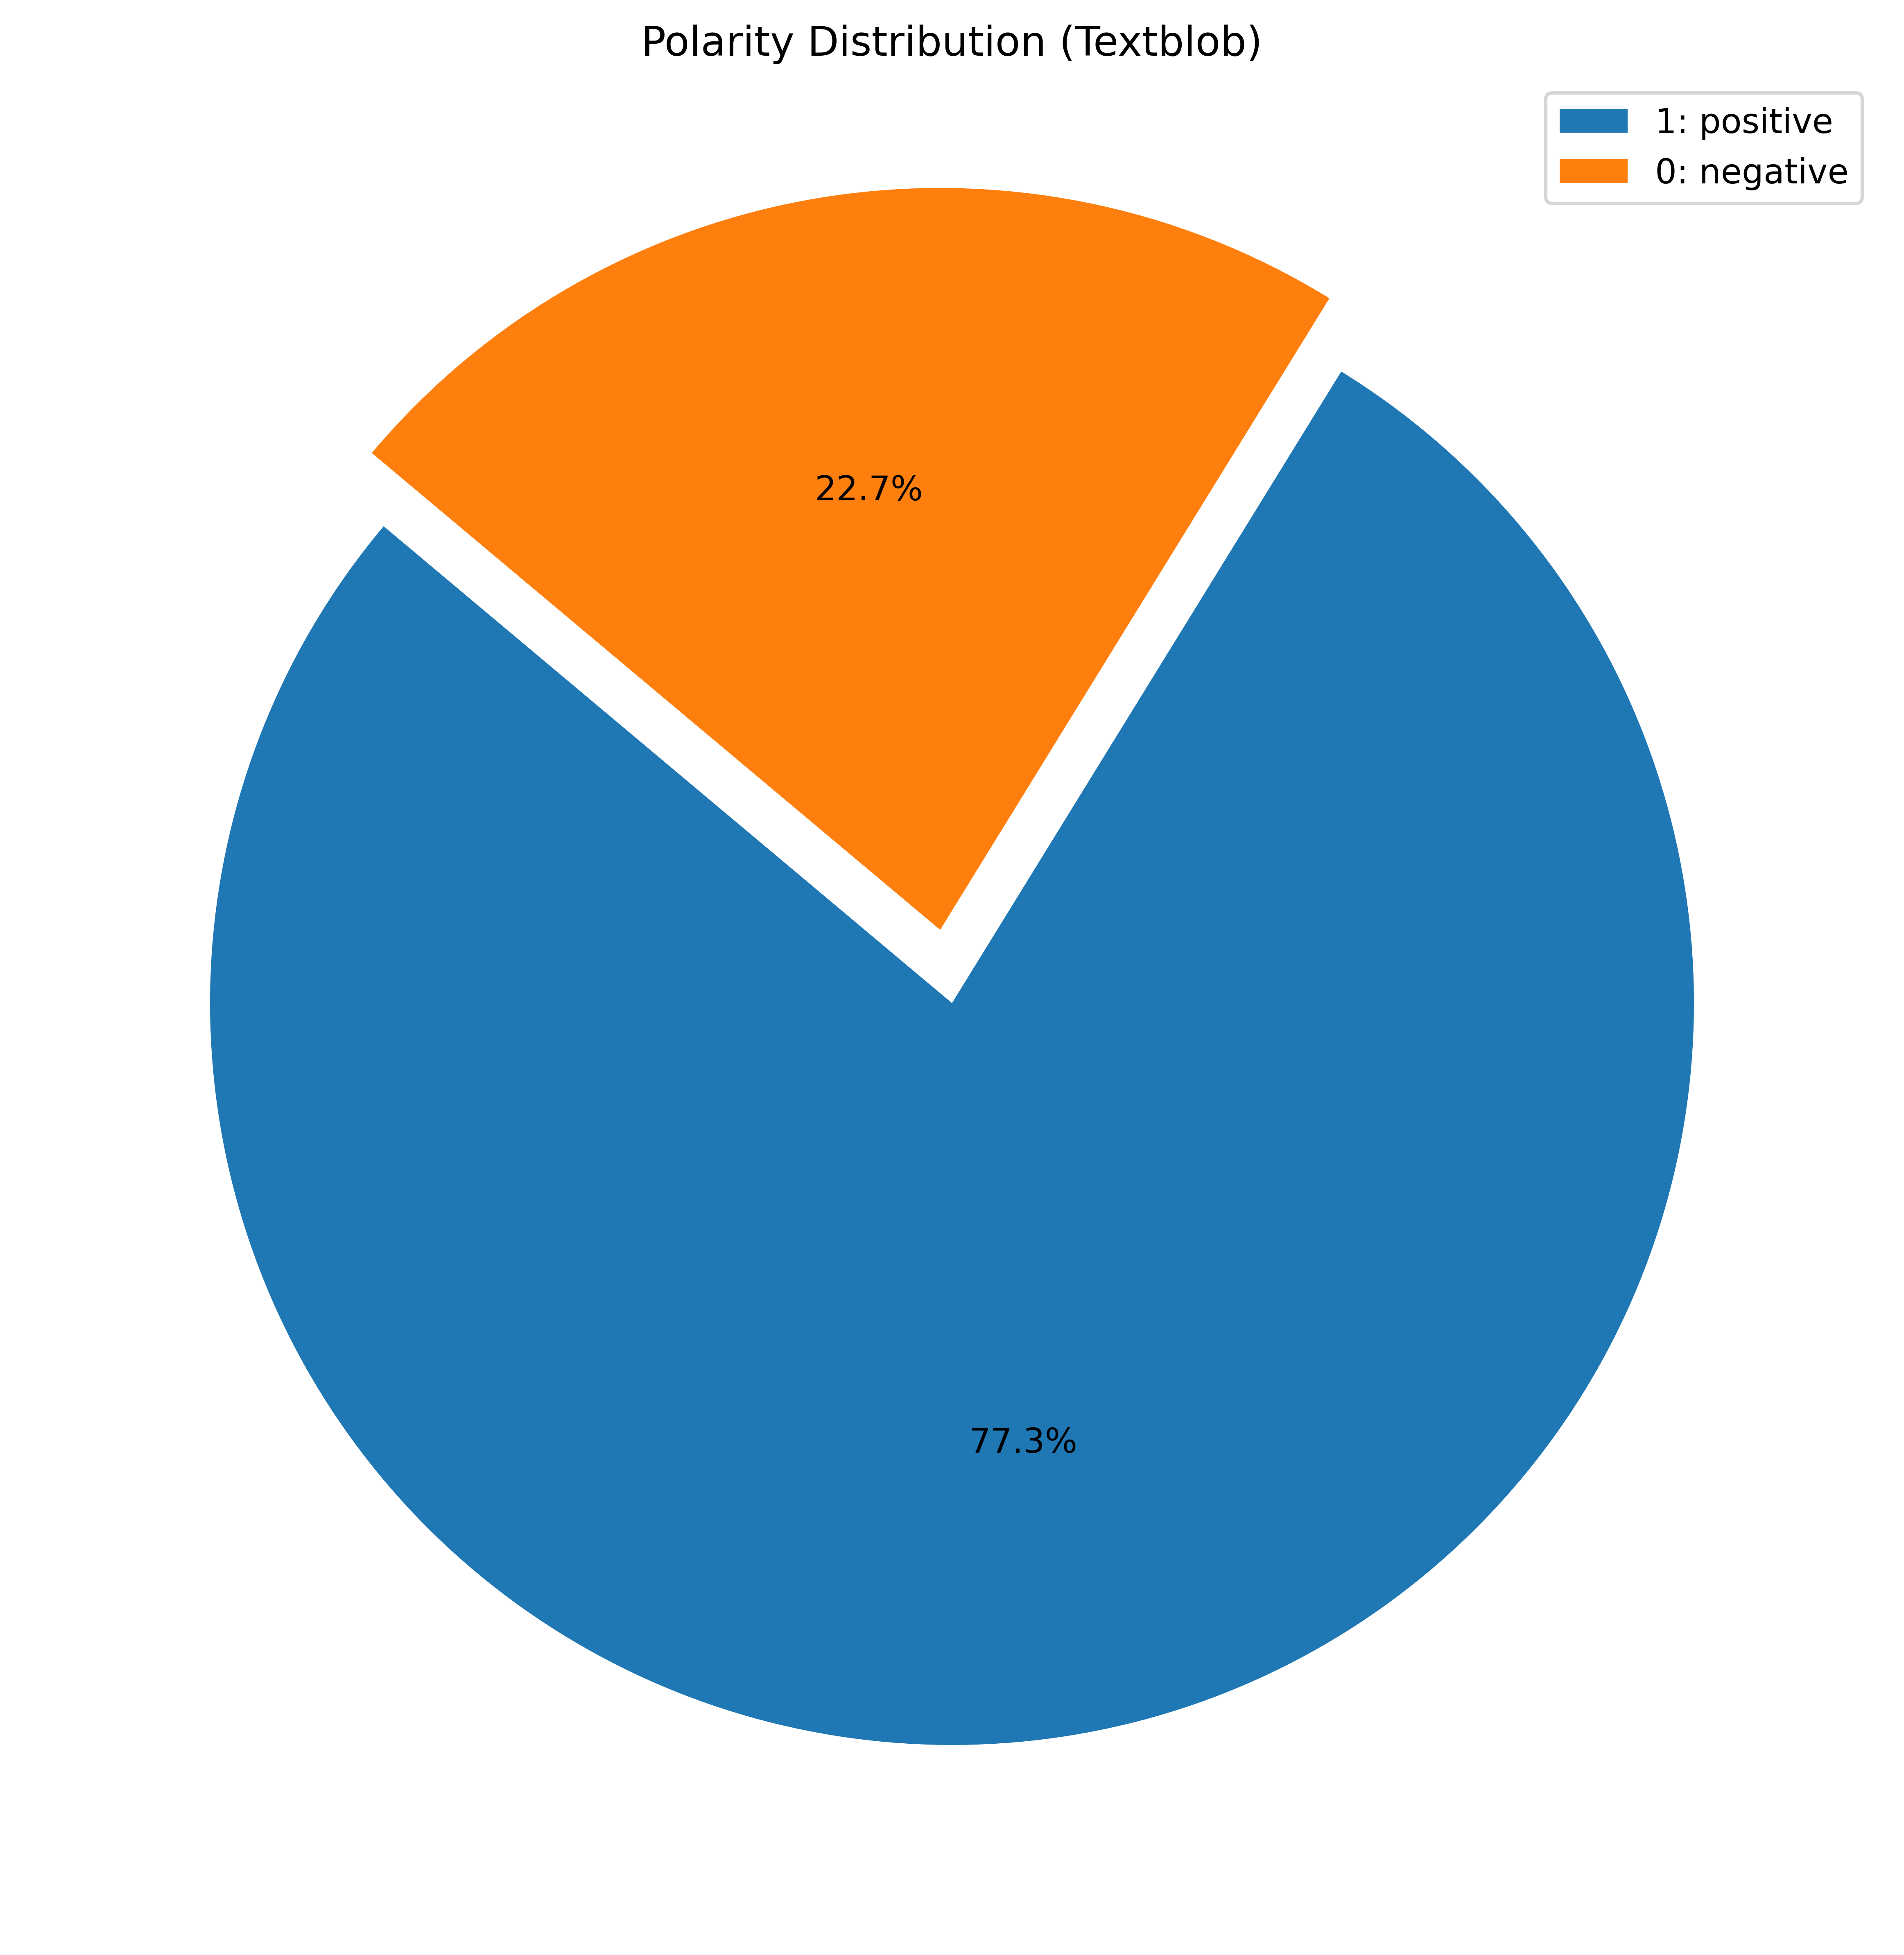
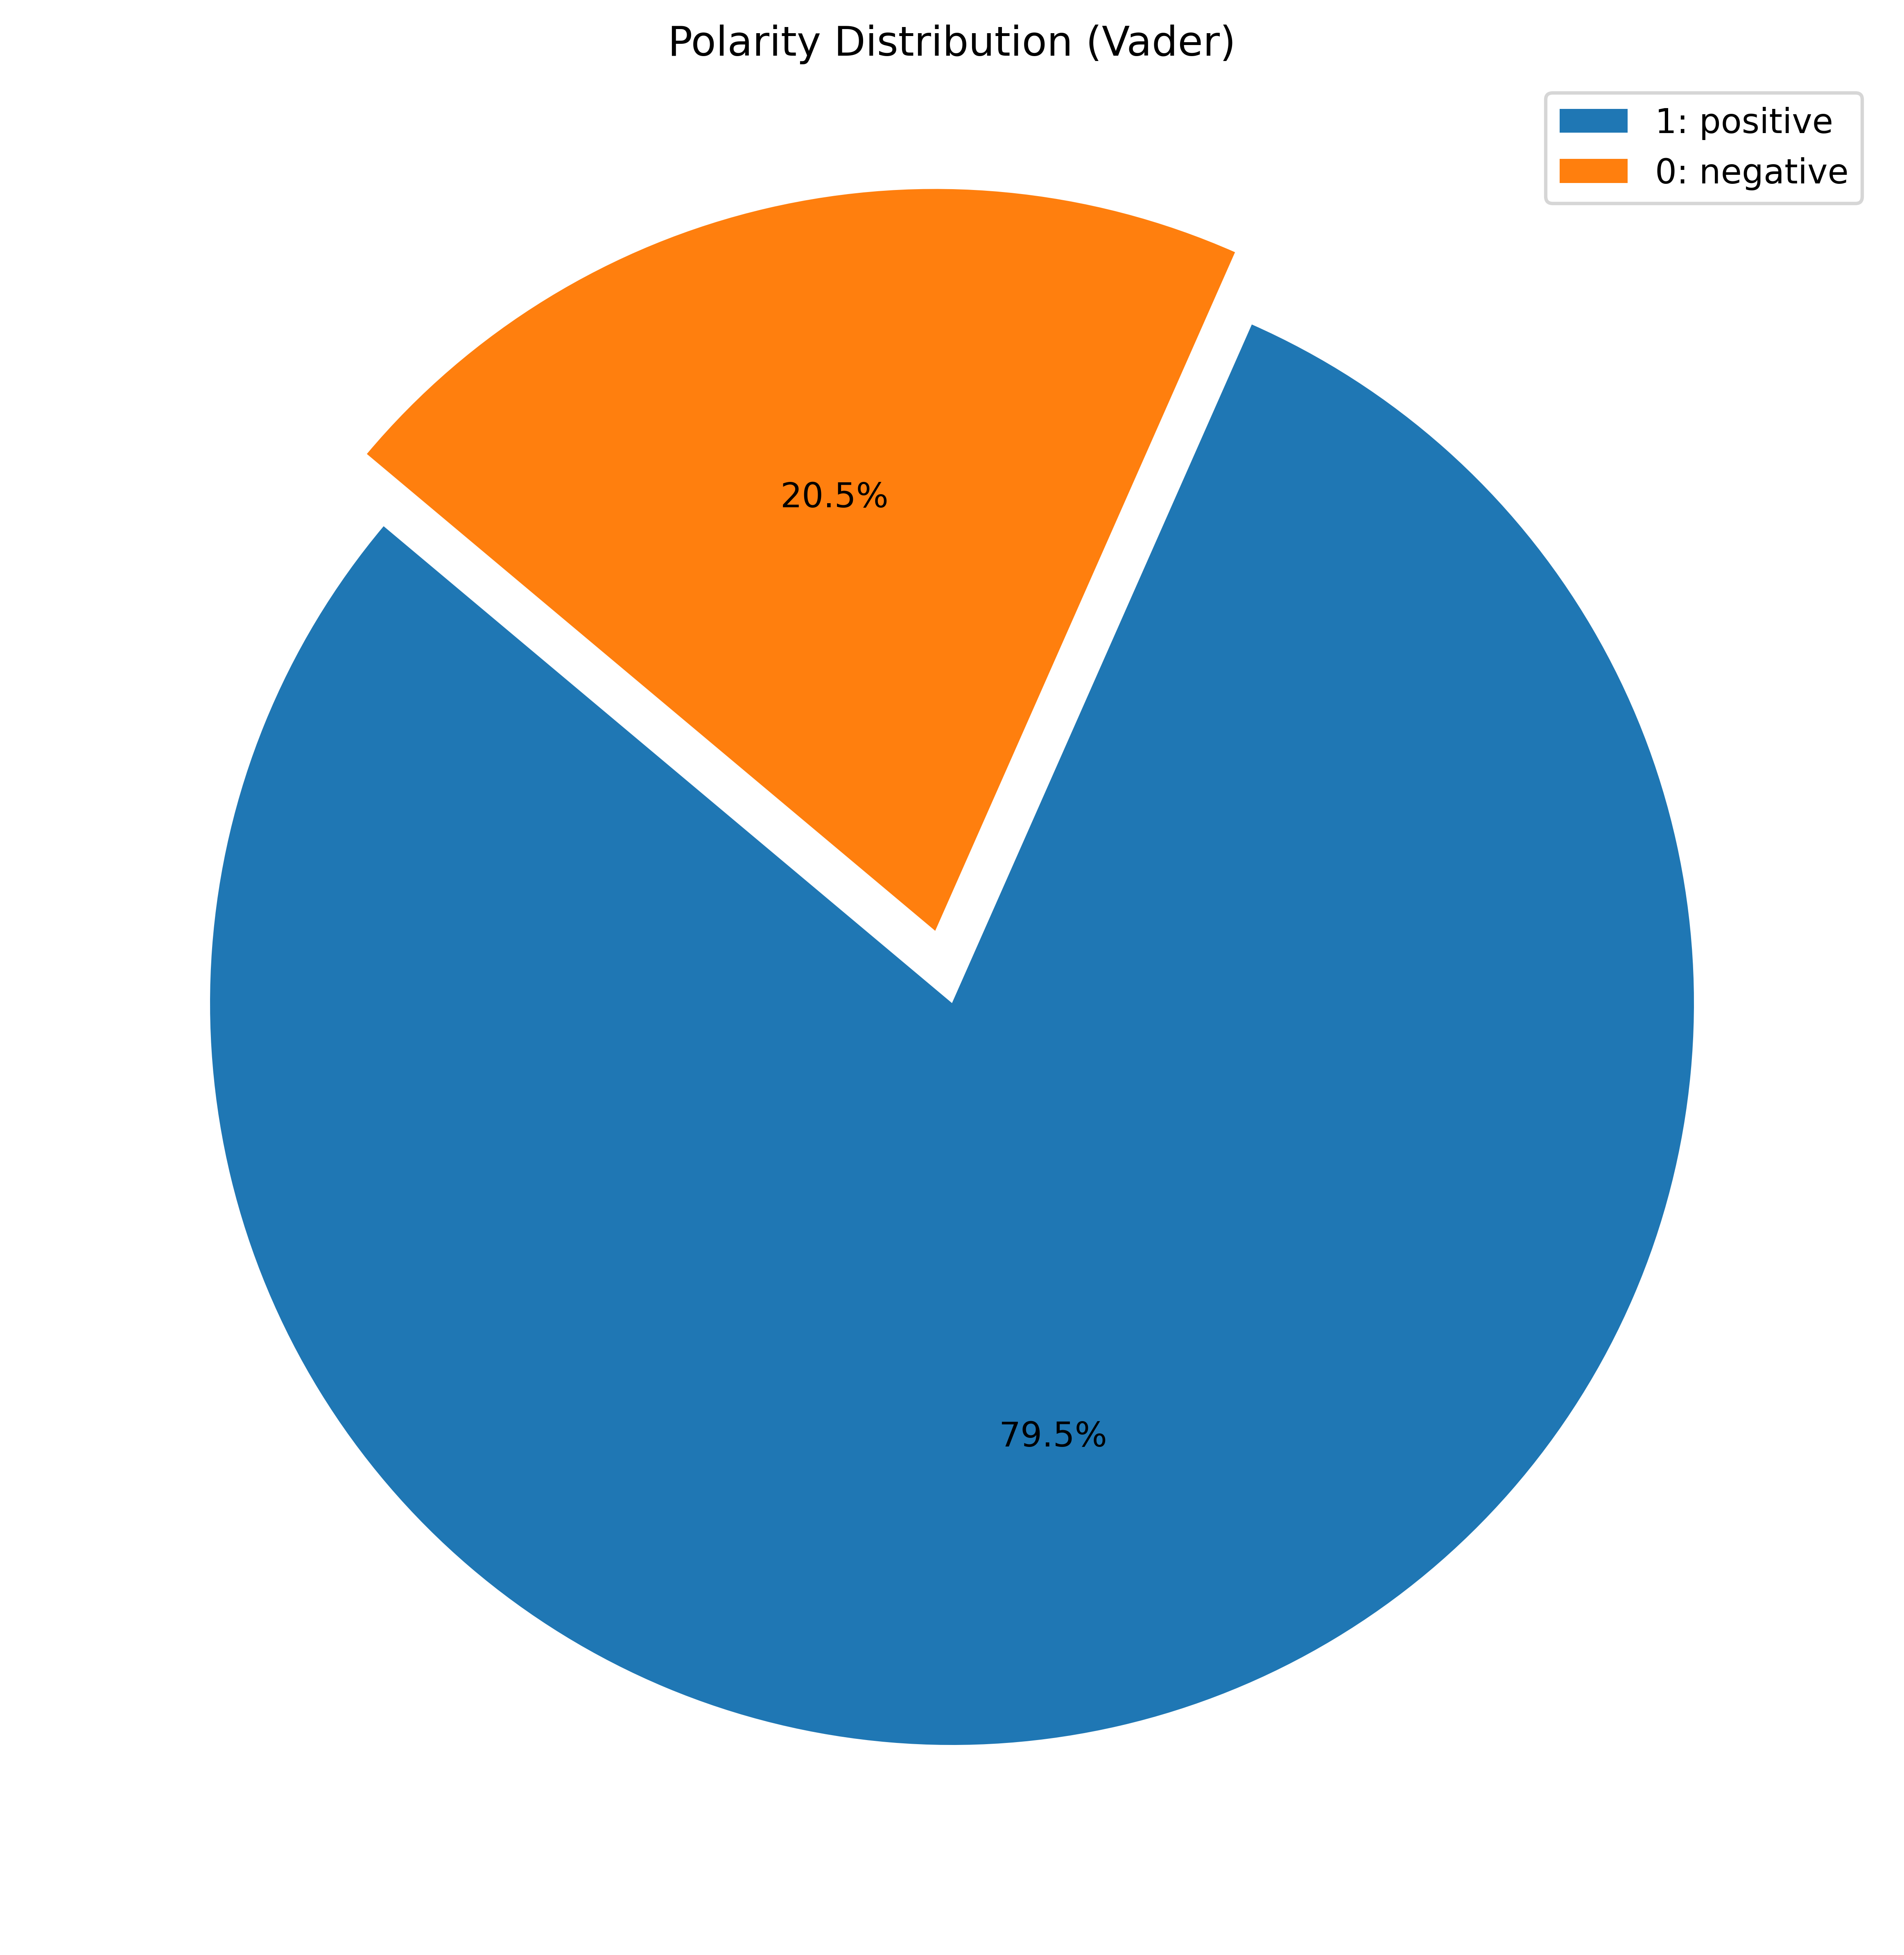
The sentiments from both the tools were then compared and visualised to check if there exist any variation in the frequency of tweet and sentiment value over the three months. Since neutral sentiments were overpowering the overall distribution, I chose to ignore it in this analysis. The sentiment distribution is shifted towards positive with the mean at 0.18 if only adjectives are considered.
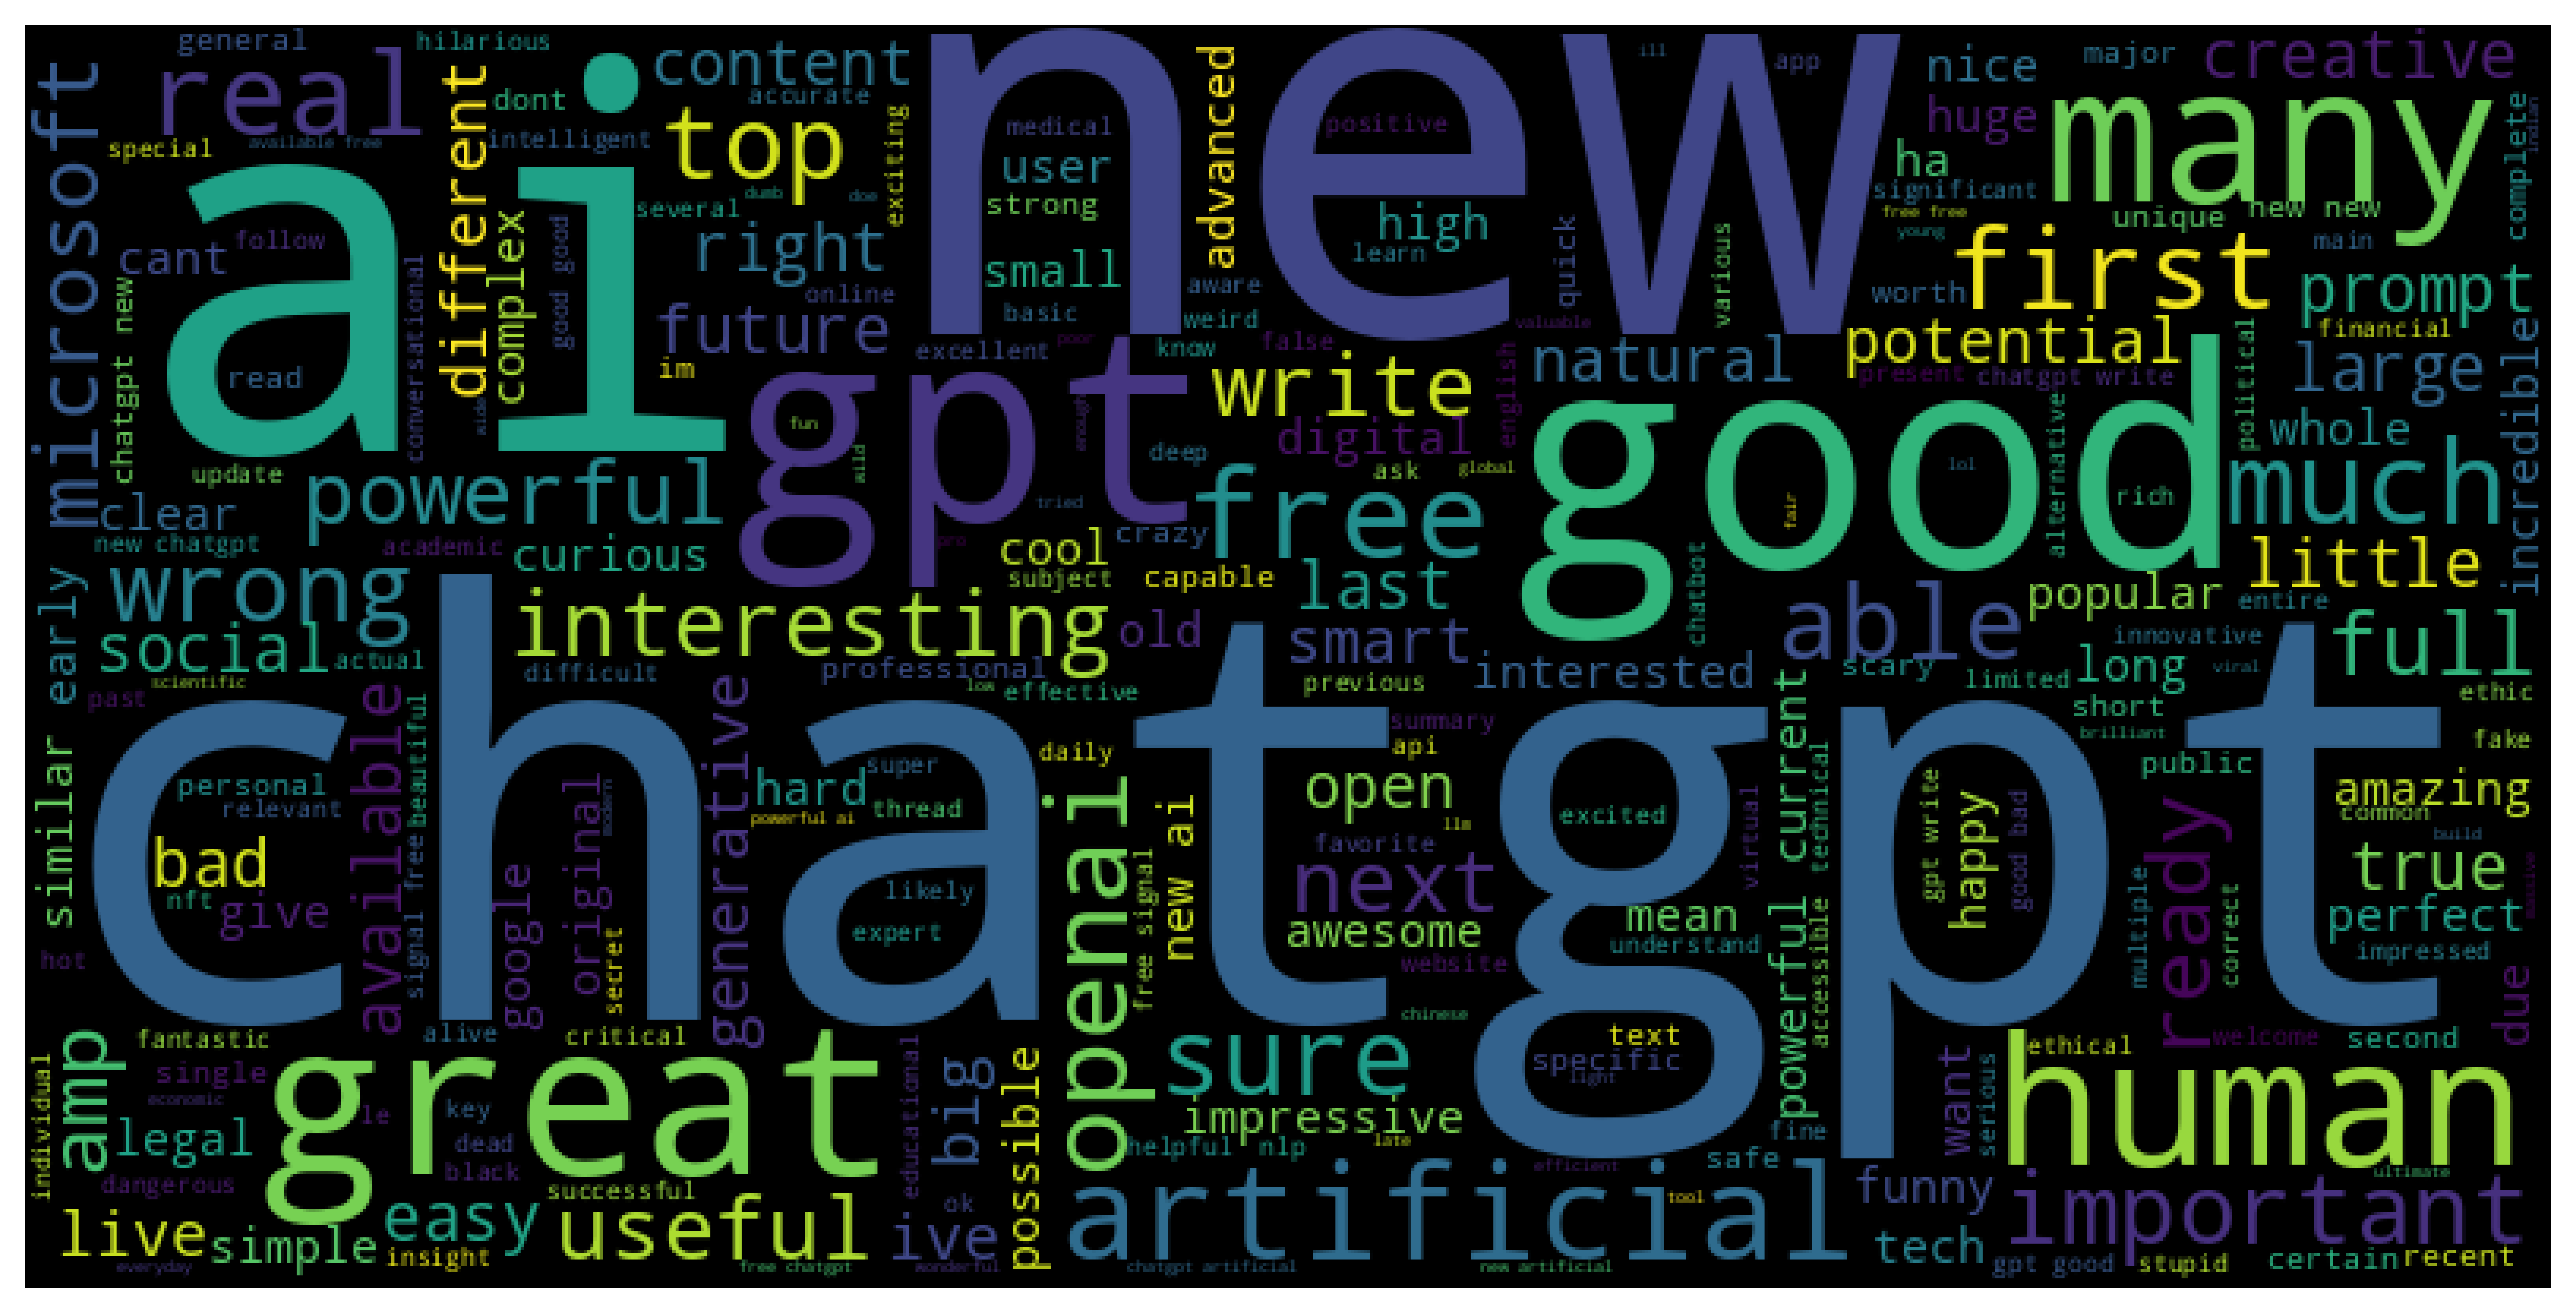
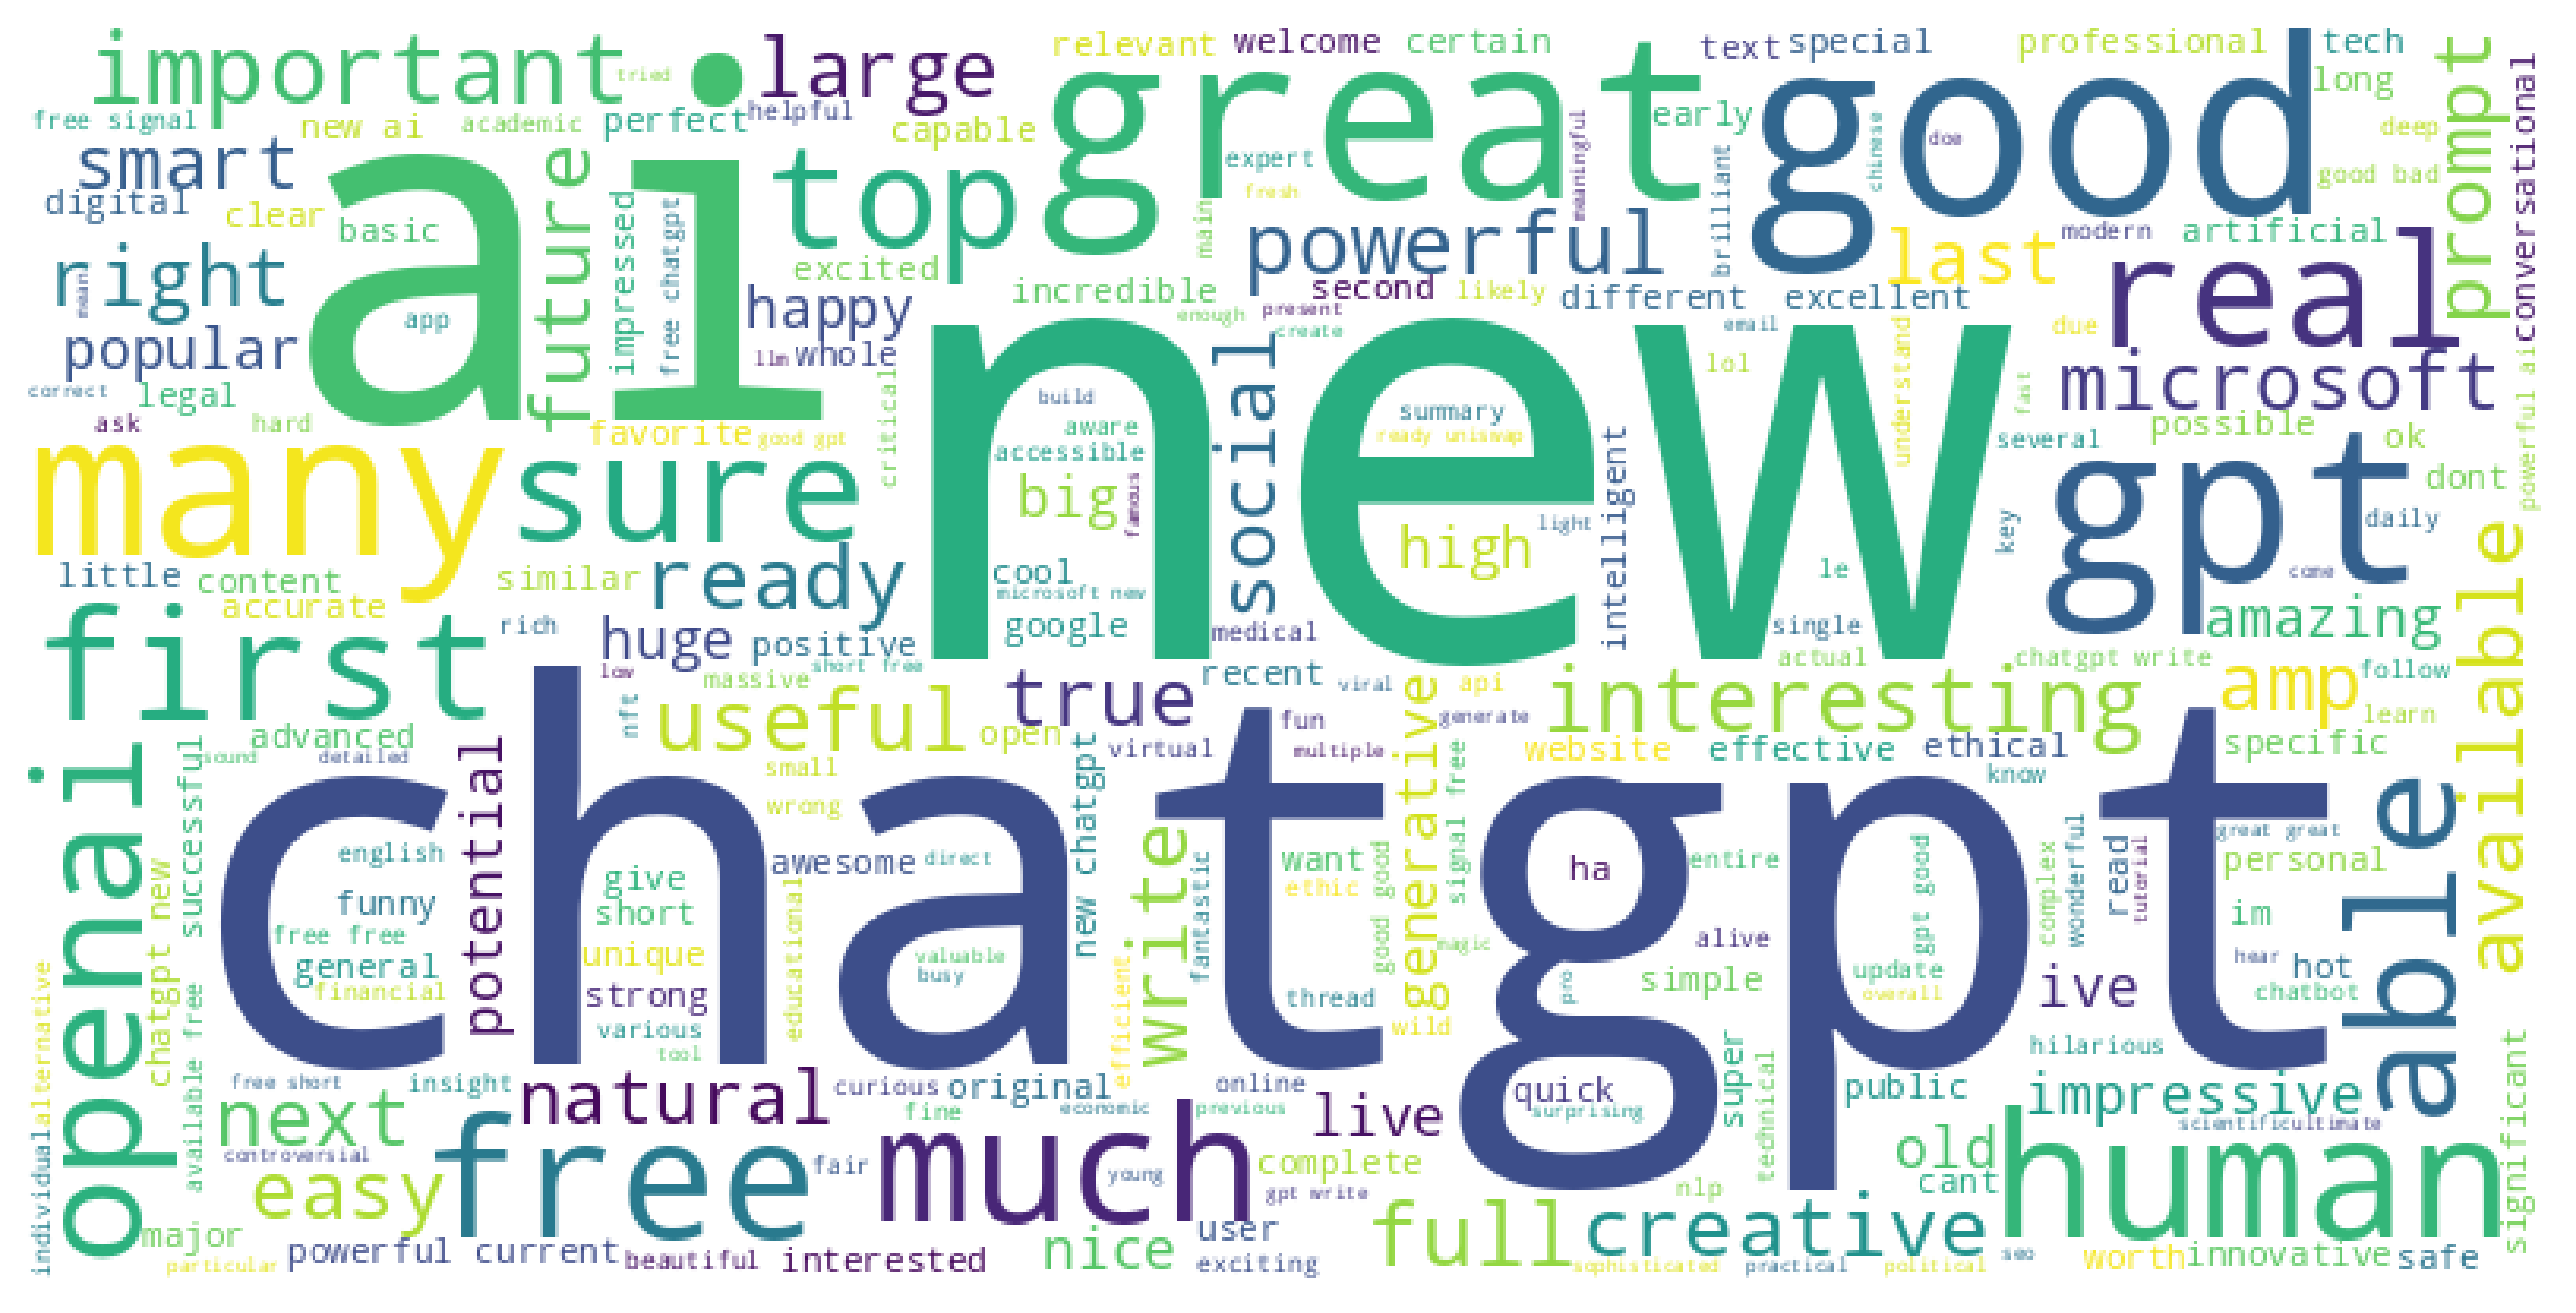
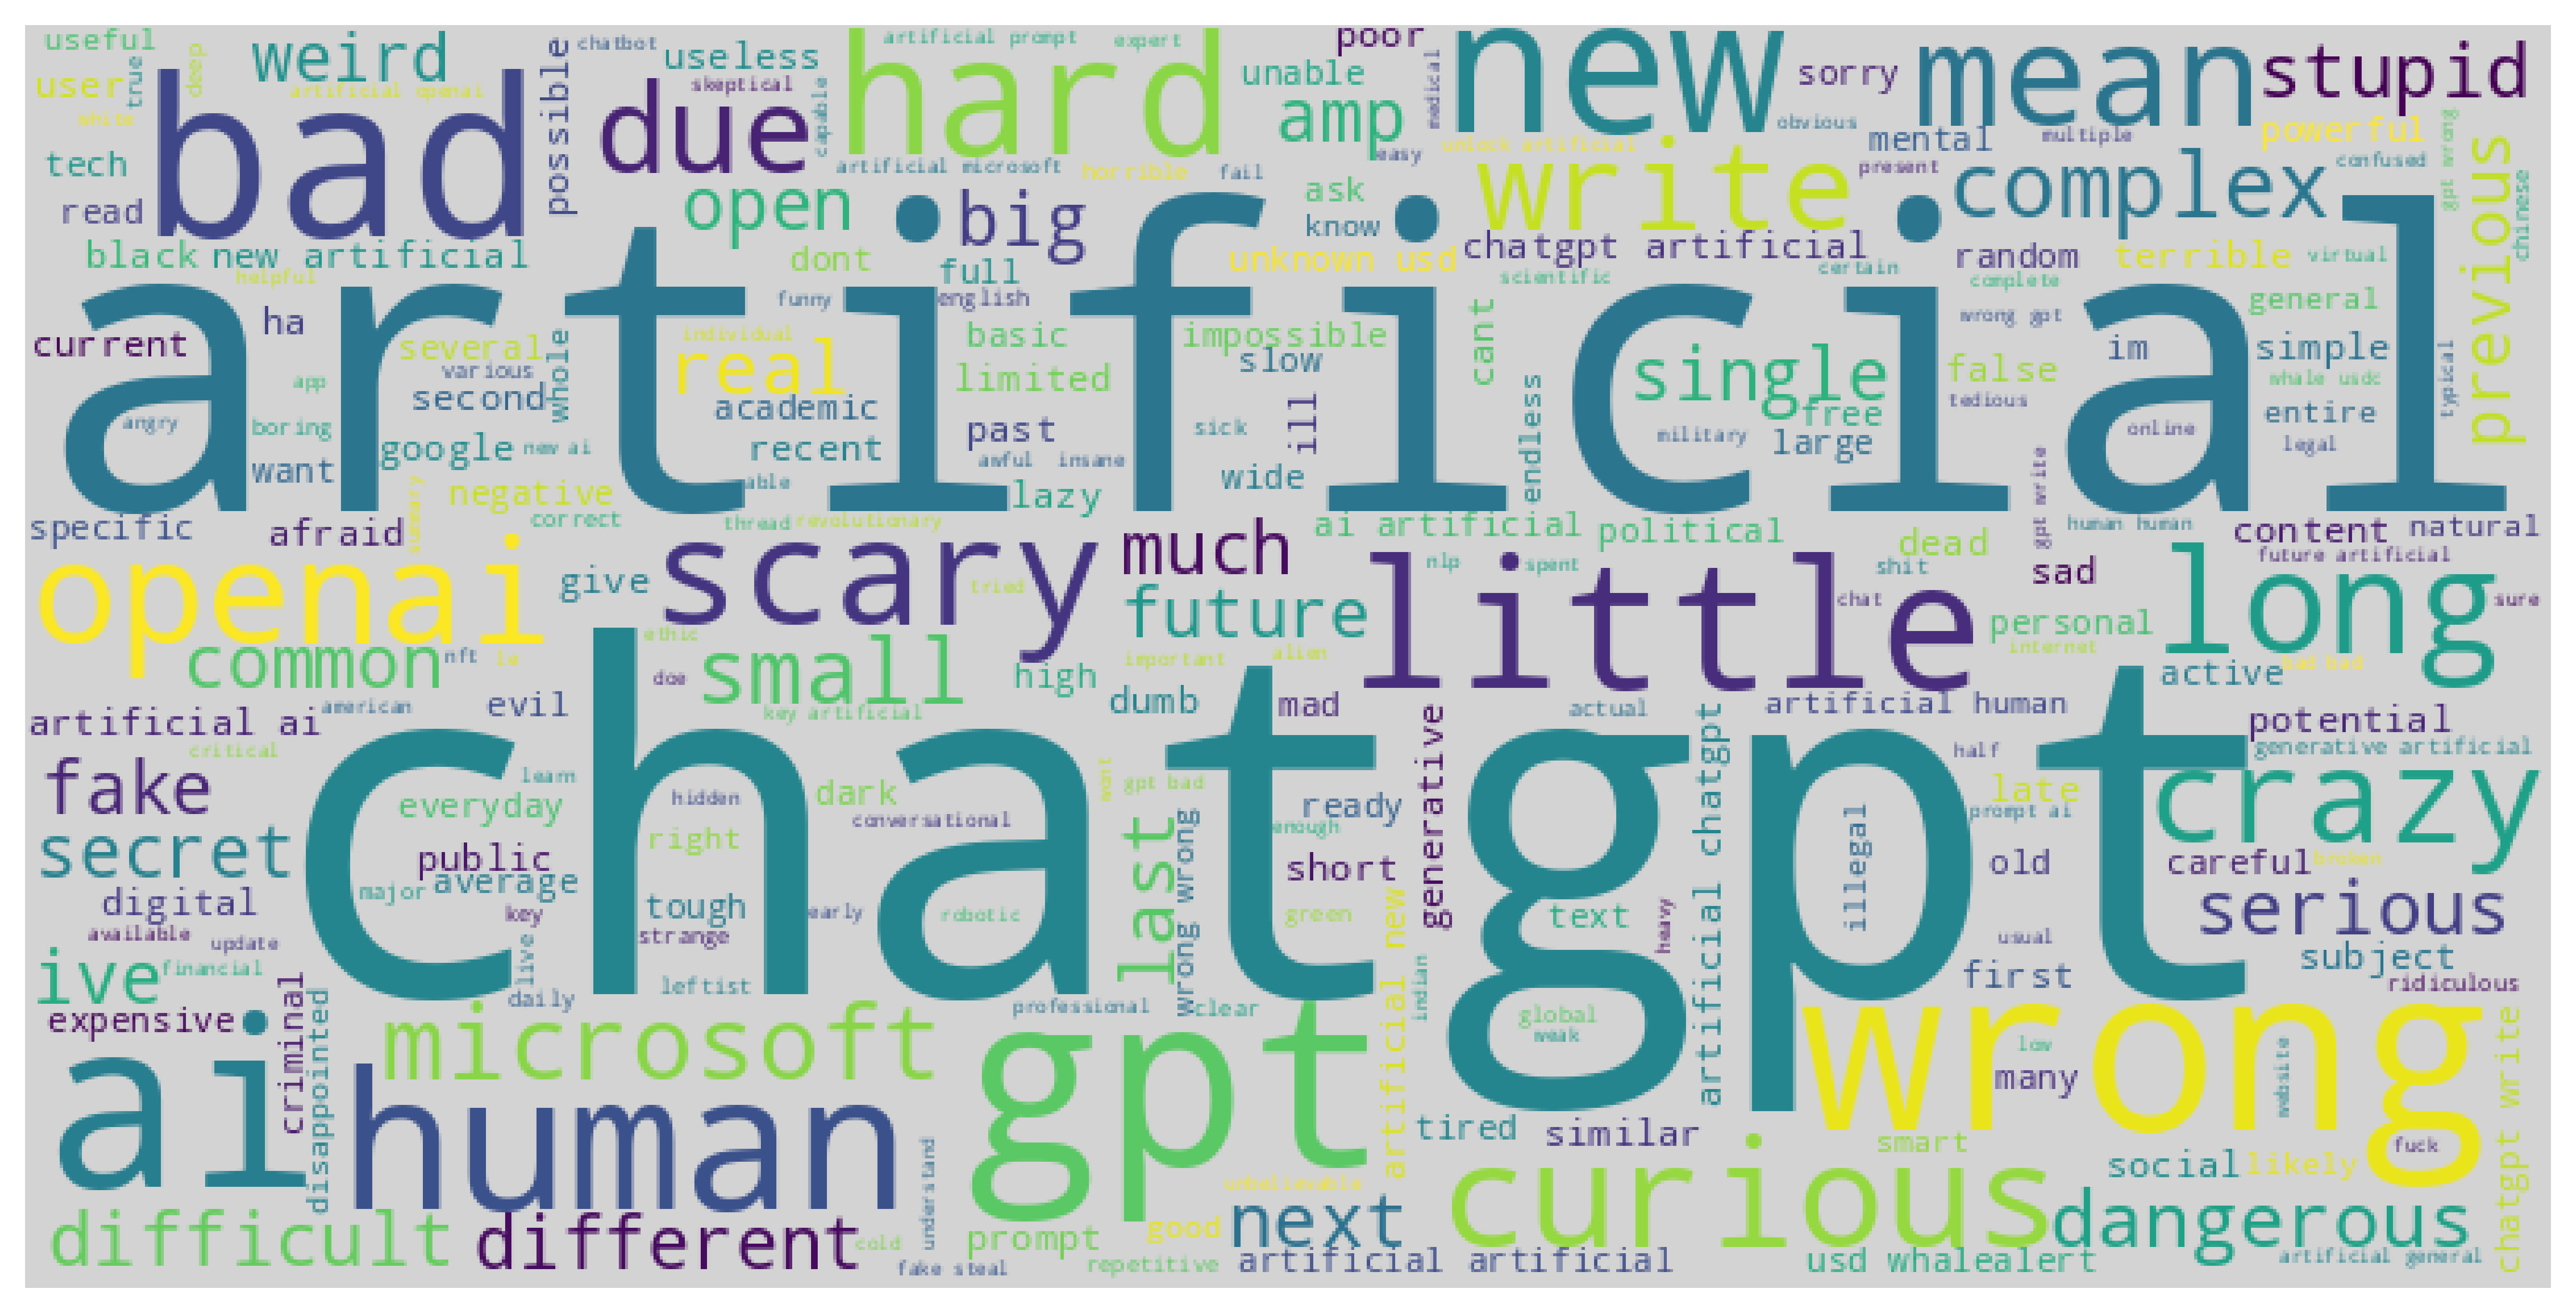
Wordclouds of both positive and negative sentiments in the tweets were made, this was especially useful after separating the adjectives from each tweet.
Application of classification models