Stock price prediction - Time Series Analysis
In this project, I analysed stock prices from 7 years of data of FAANG companies. I used the time-series to model ARIMA, SARIMA, and Prophet models and forecasted the future stock price trend for Amazon.
Data
- The data for this project was taken from Kaggle
Comparative analysis of FAANG companies:
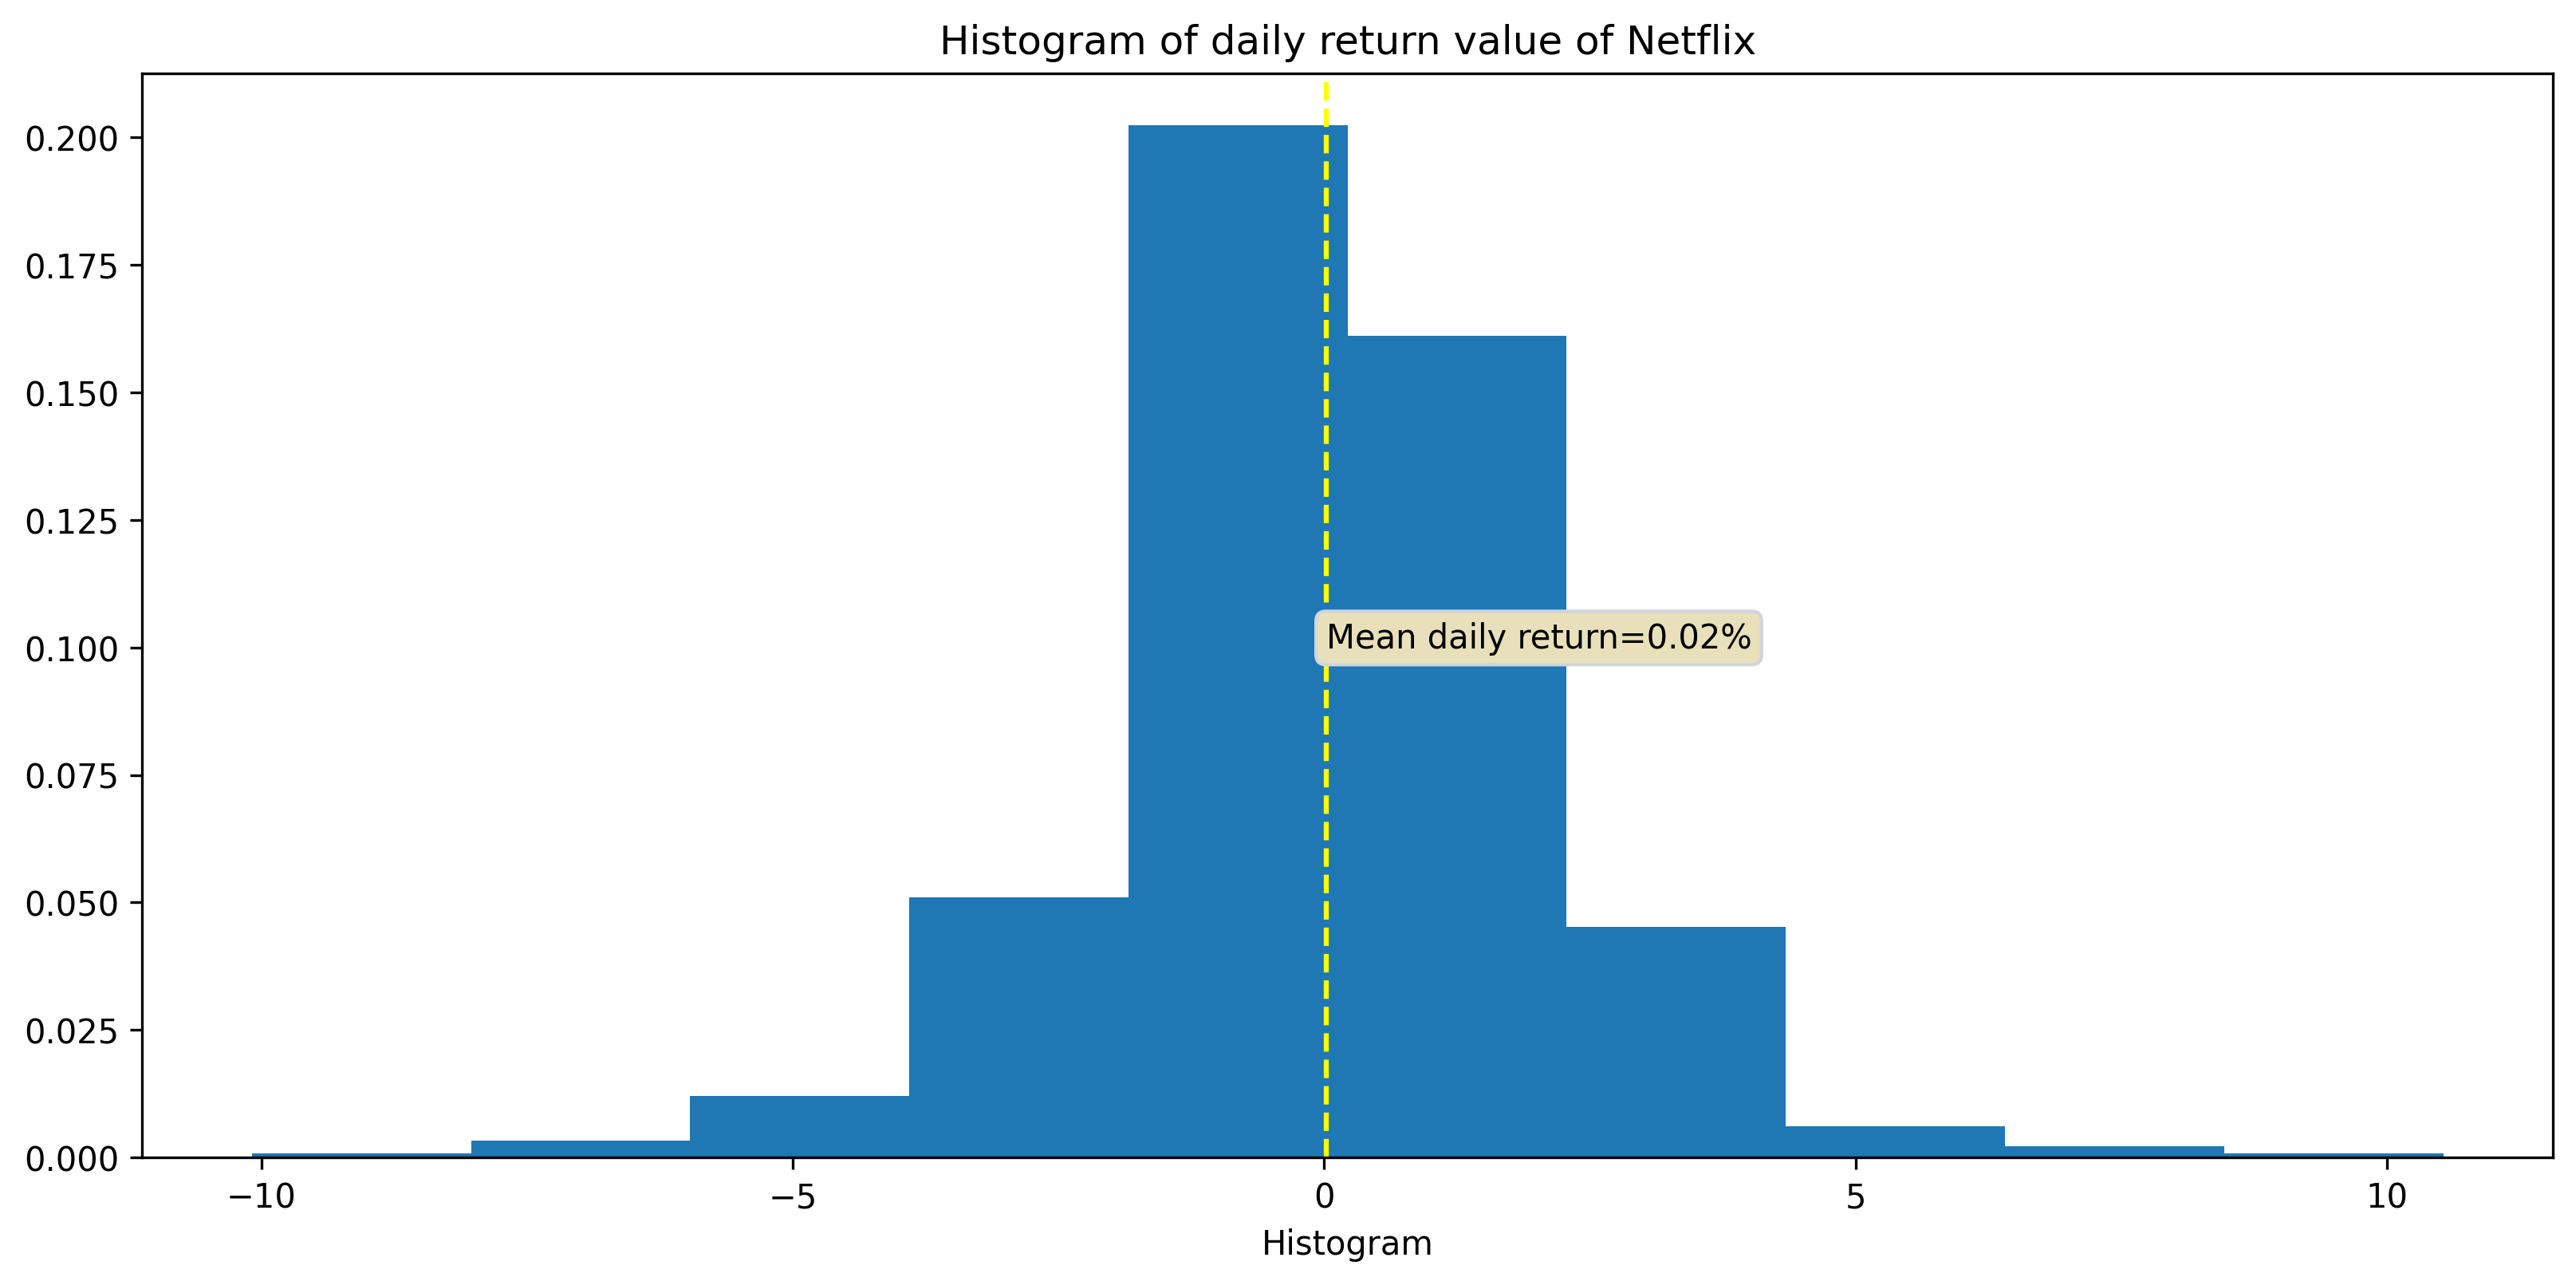
Netflix has the most variation of all these in the daily return price.
Next, I see if the stock price of these companies are correlated with each other.
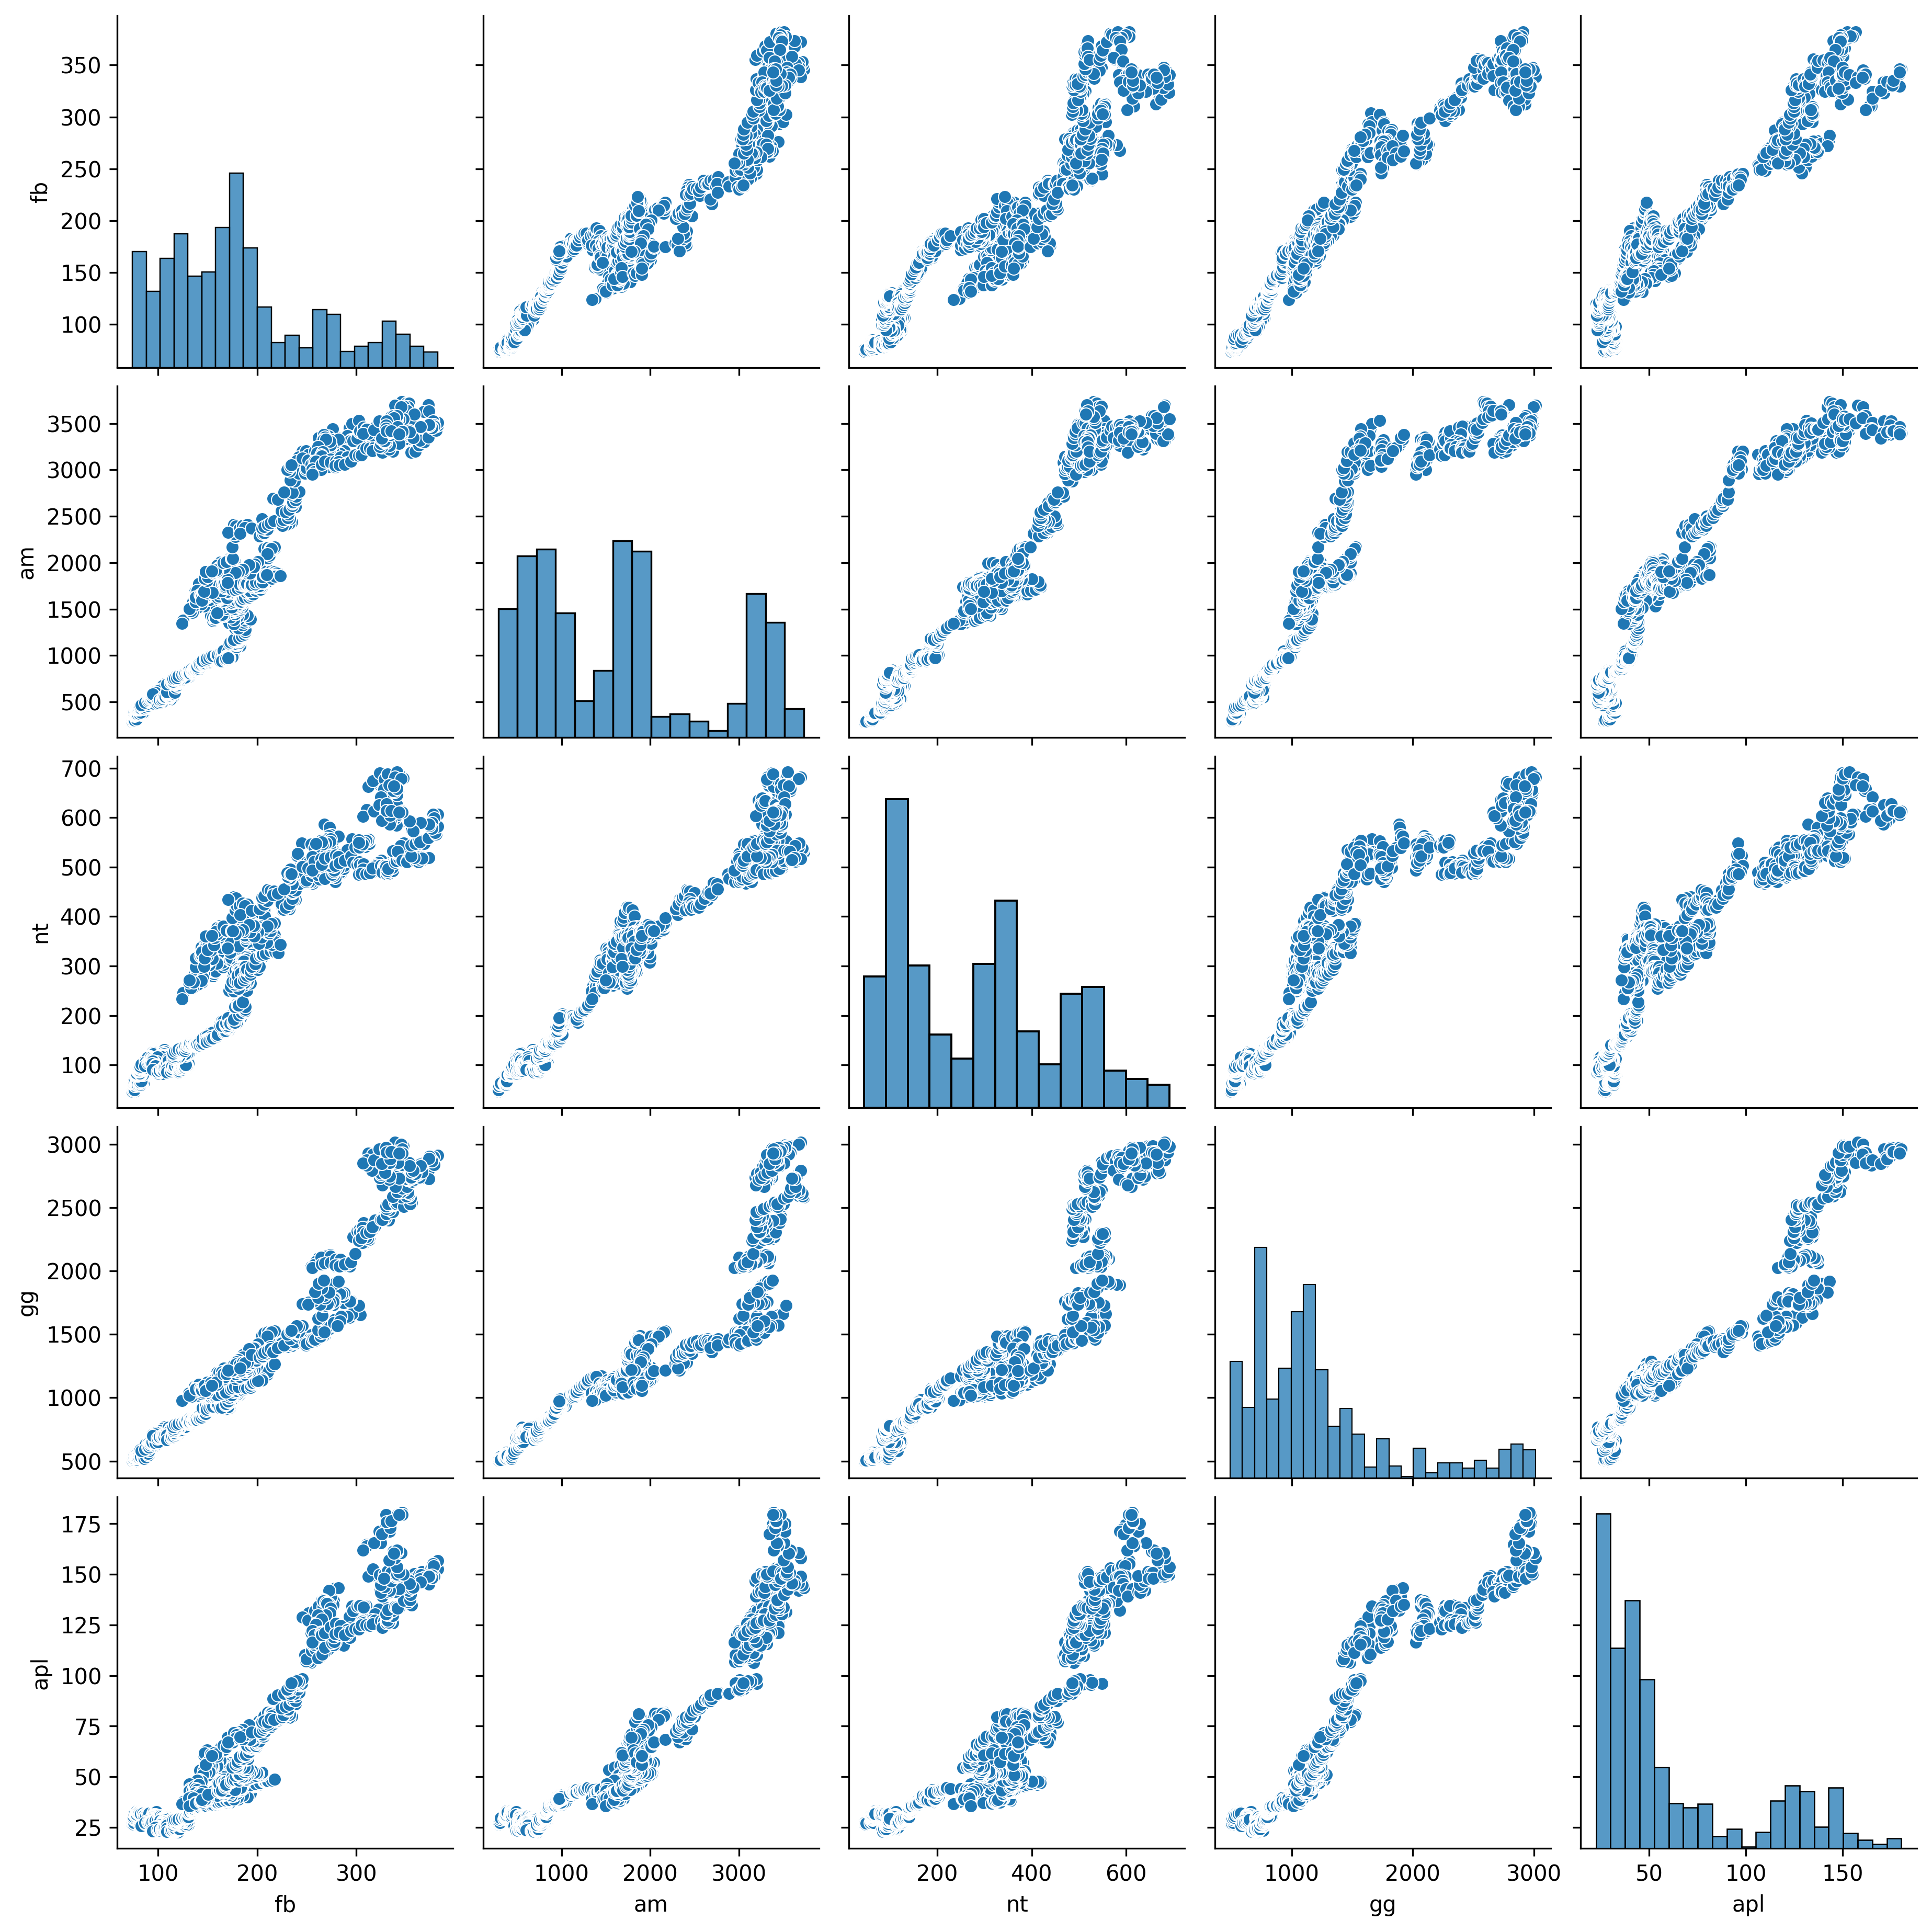
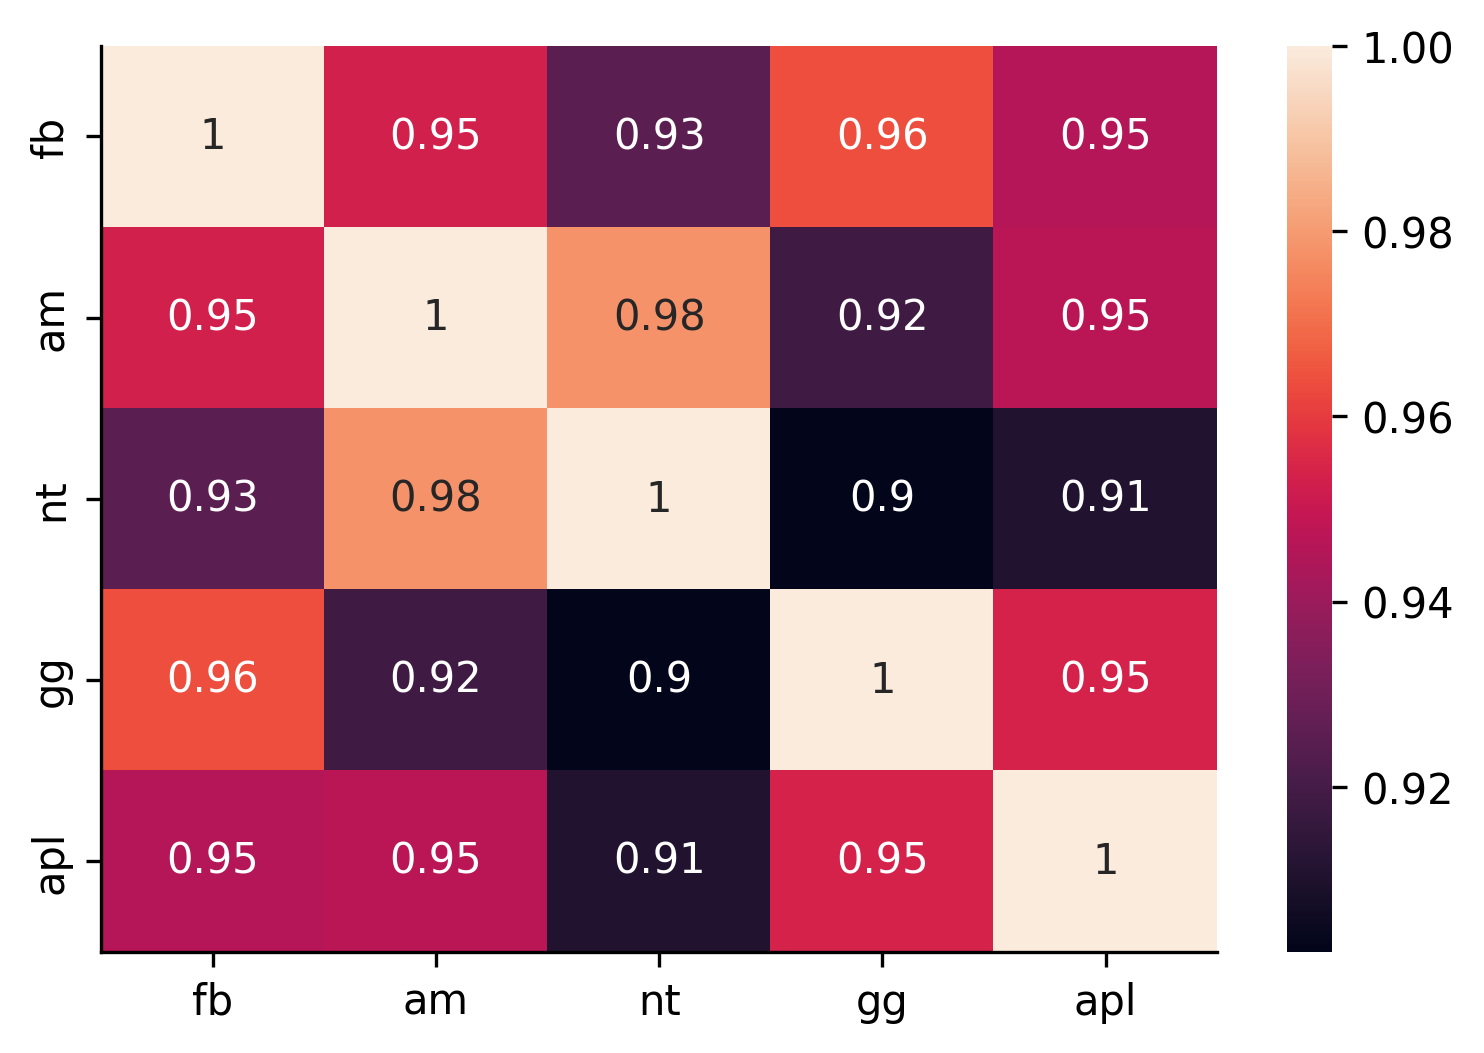
There is maximum correlation between stock price of Amazon and Netflix, and Google and Facebook
Analysing now the daily return of each stock for these companies:
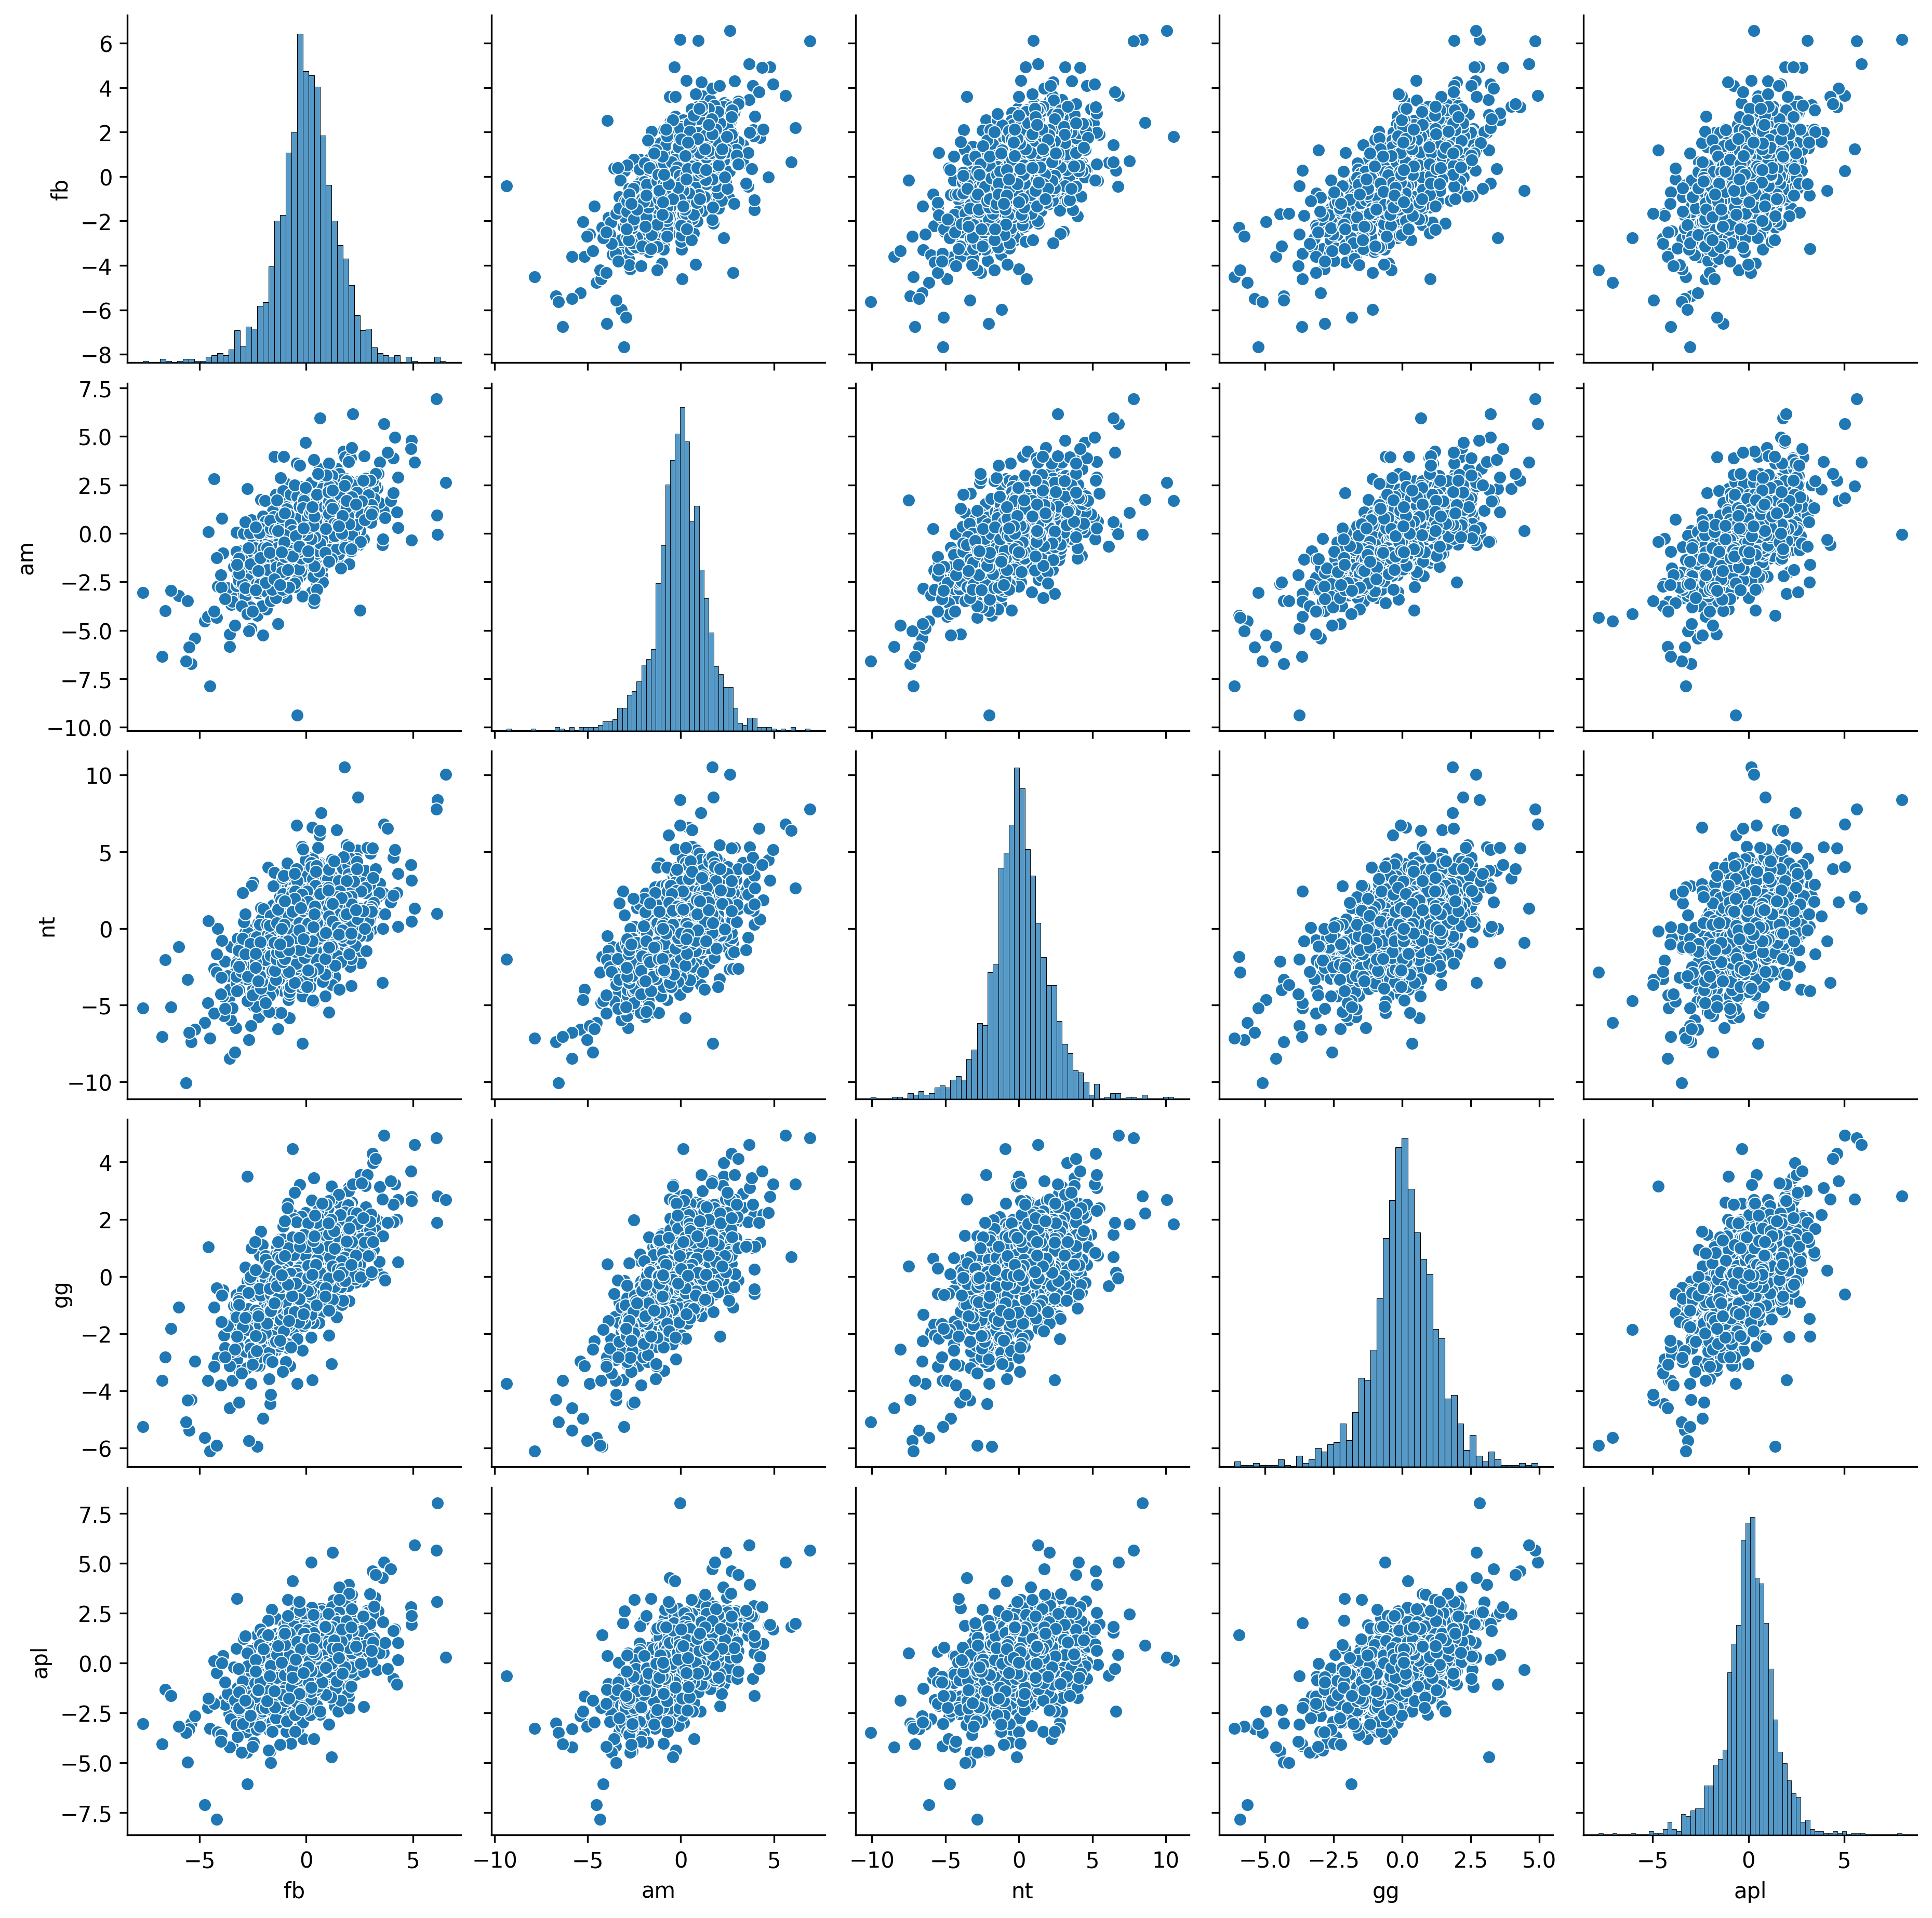
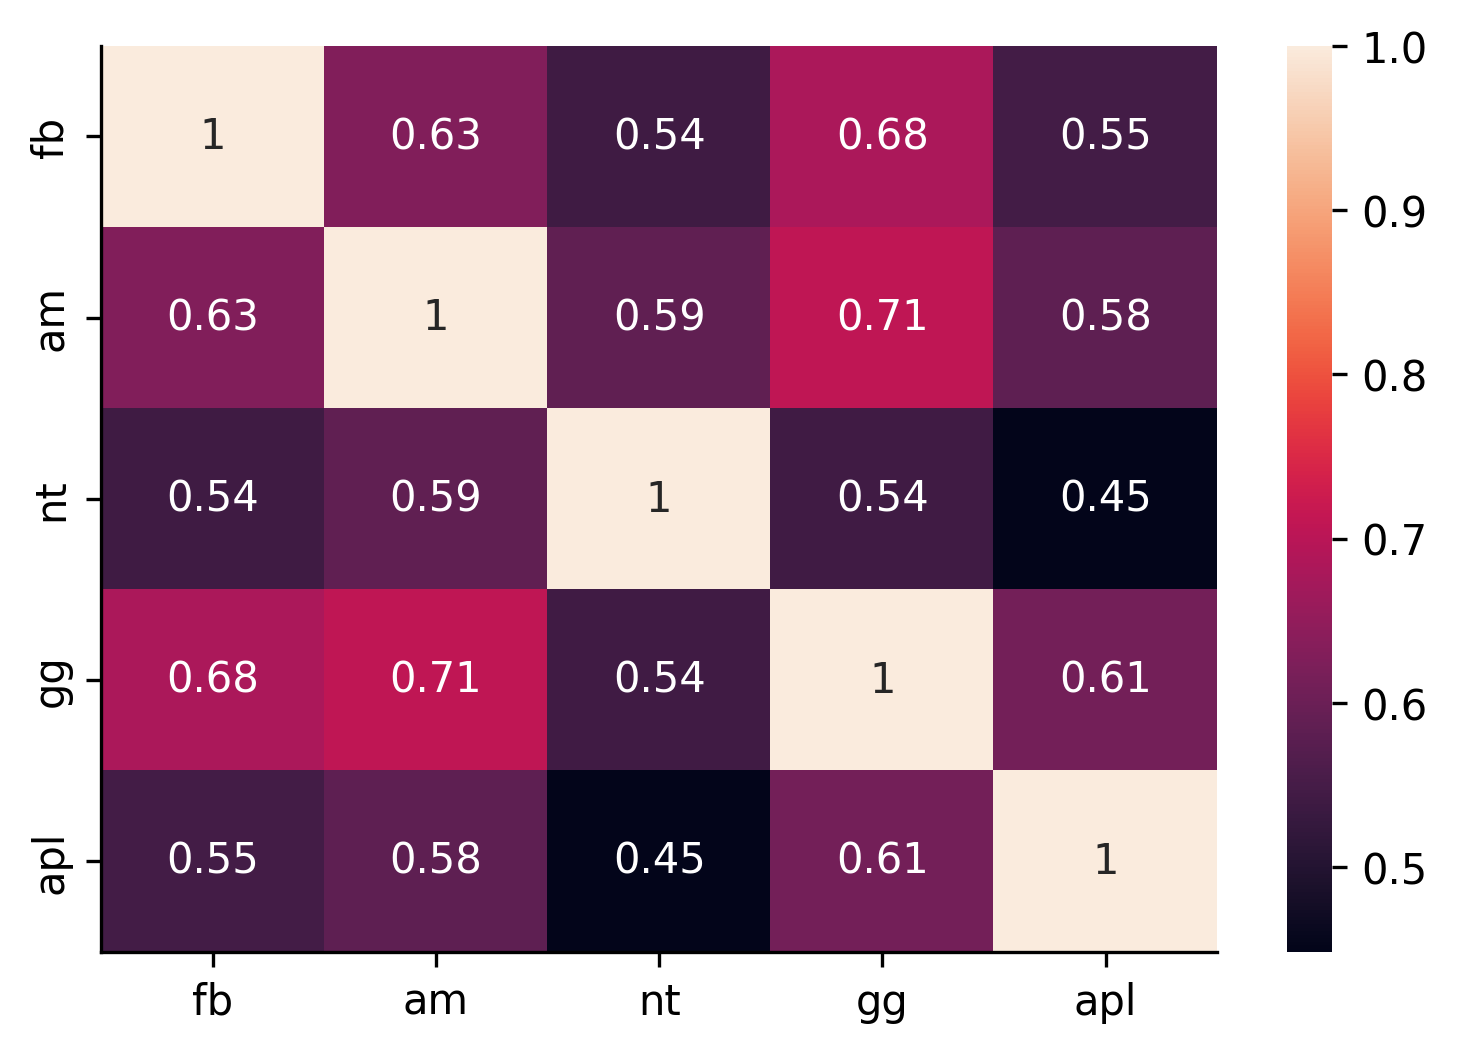
Maximum correlation on daily return is between Amazon and Google, there is also some between google and facebook
STOCK PRICE GROWTH in the last 4 years:
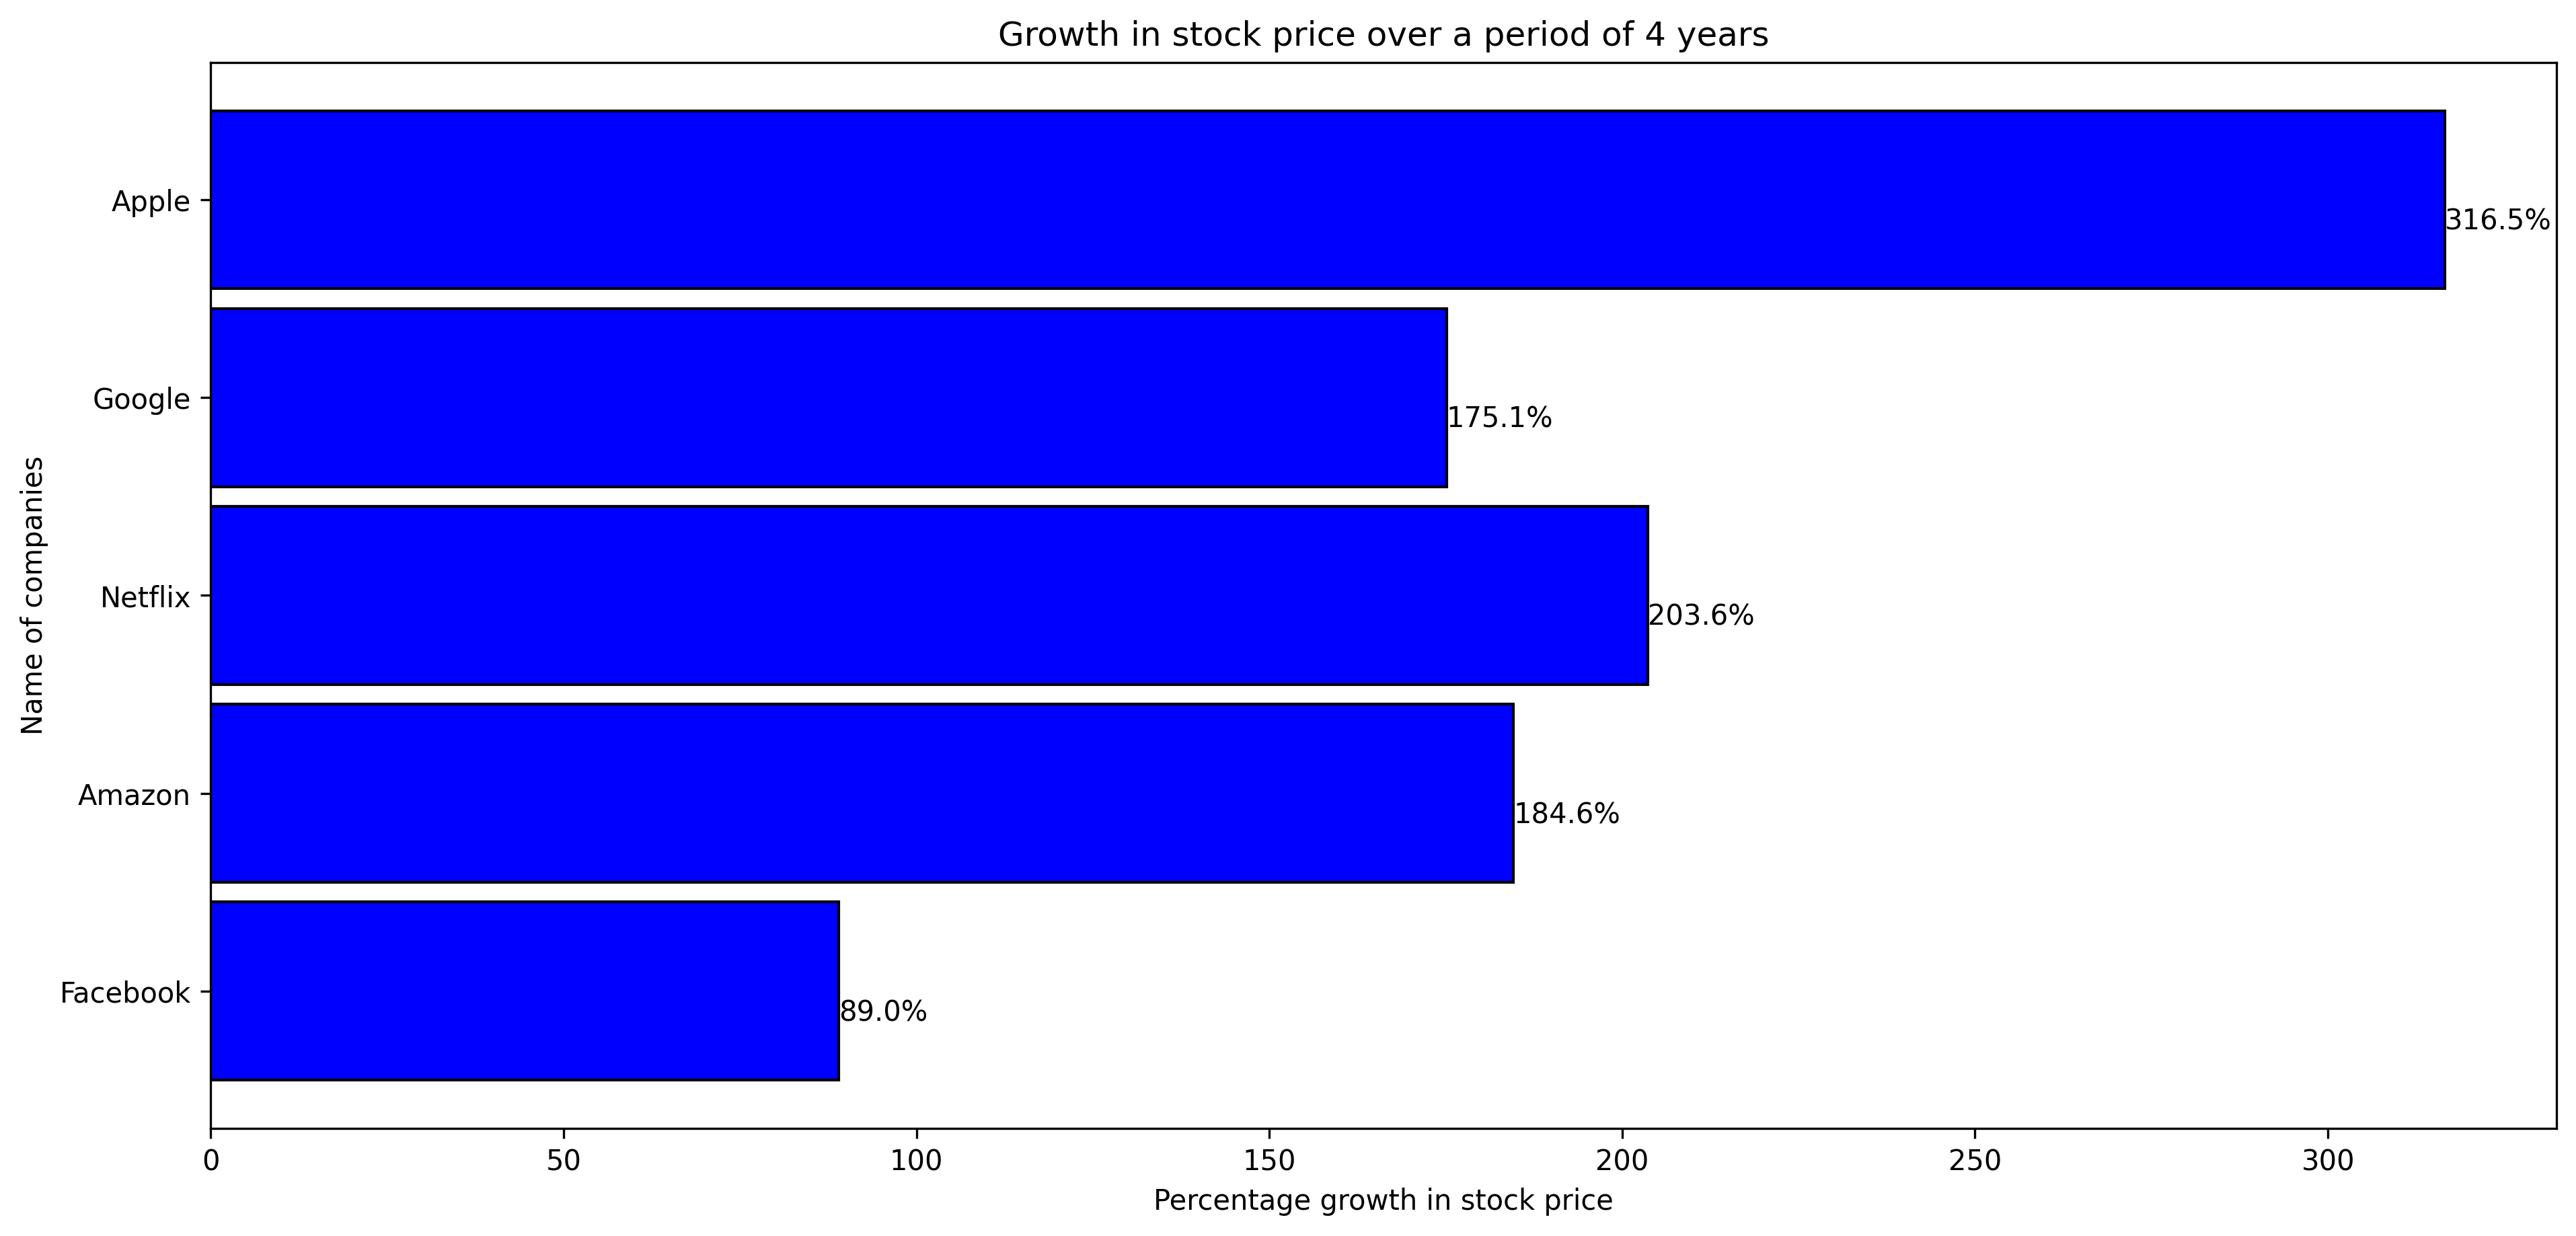
Maximum Growth is of Apple and second place is held by Netflix.
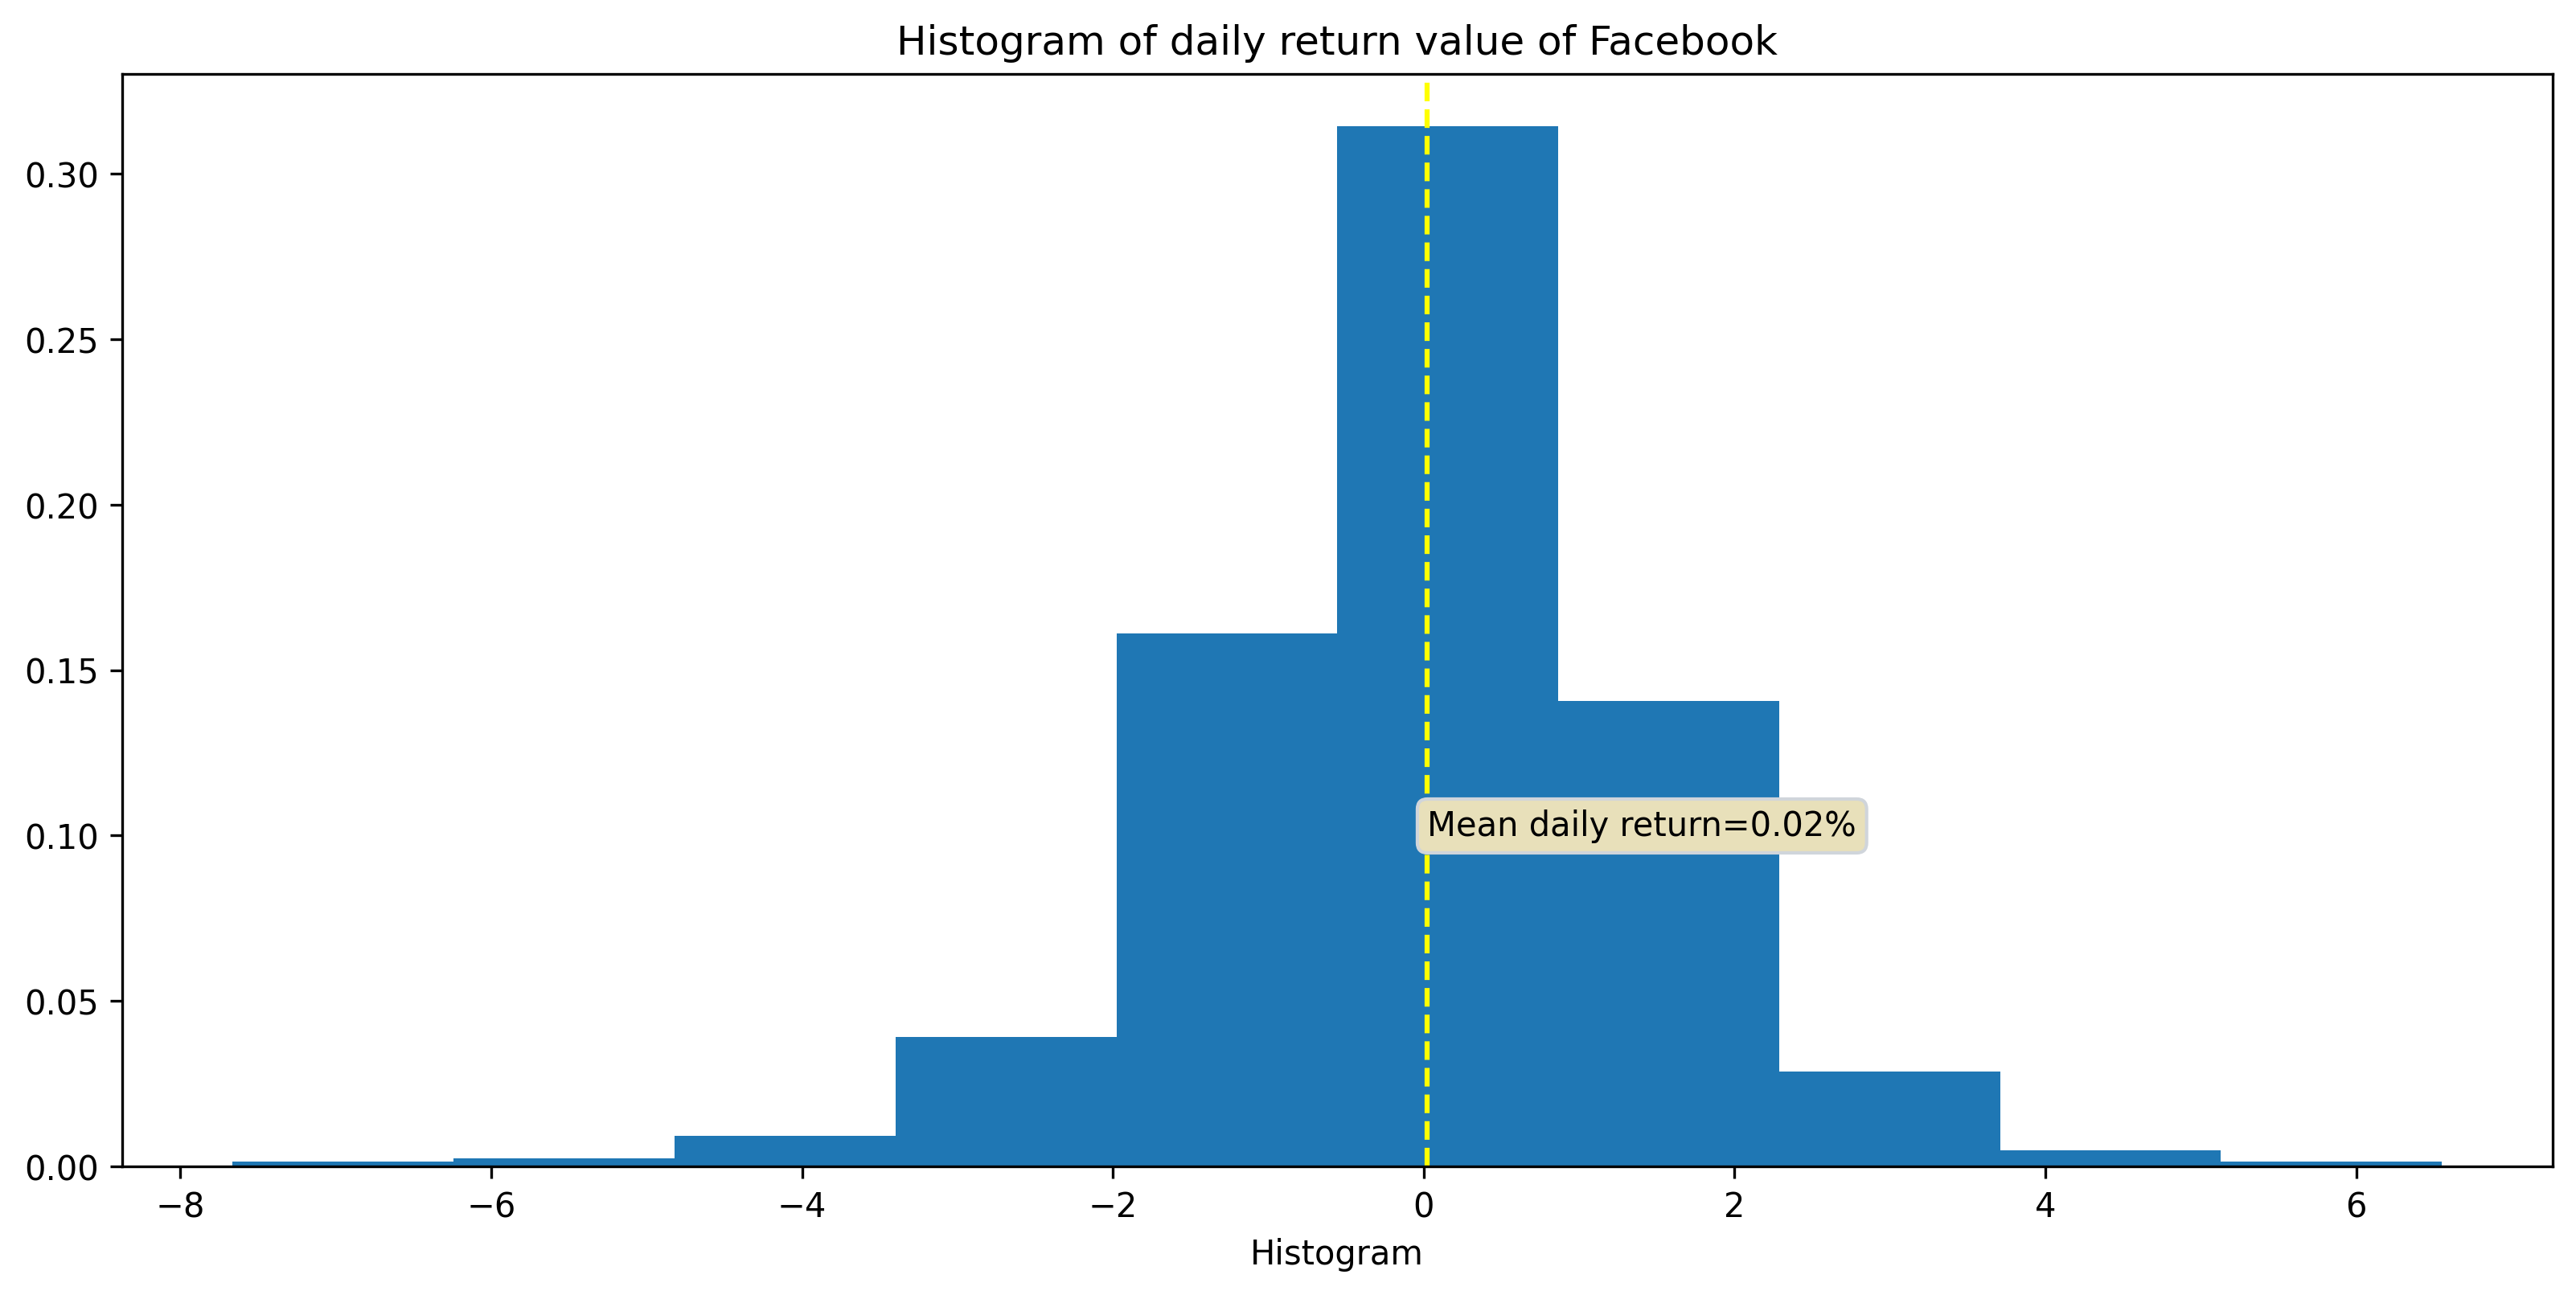
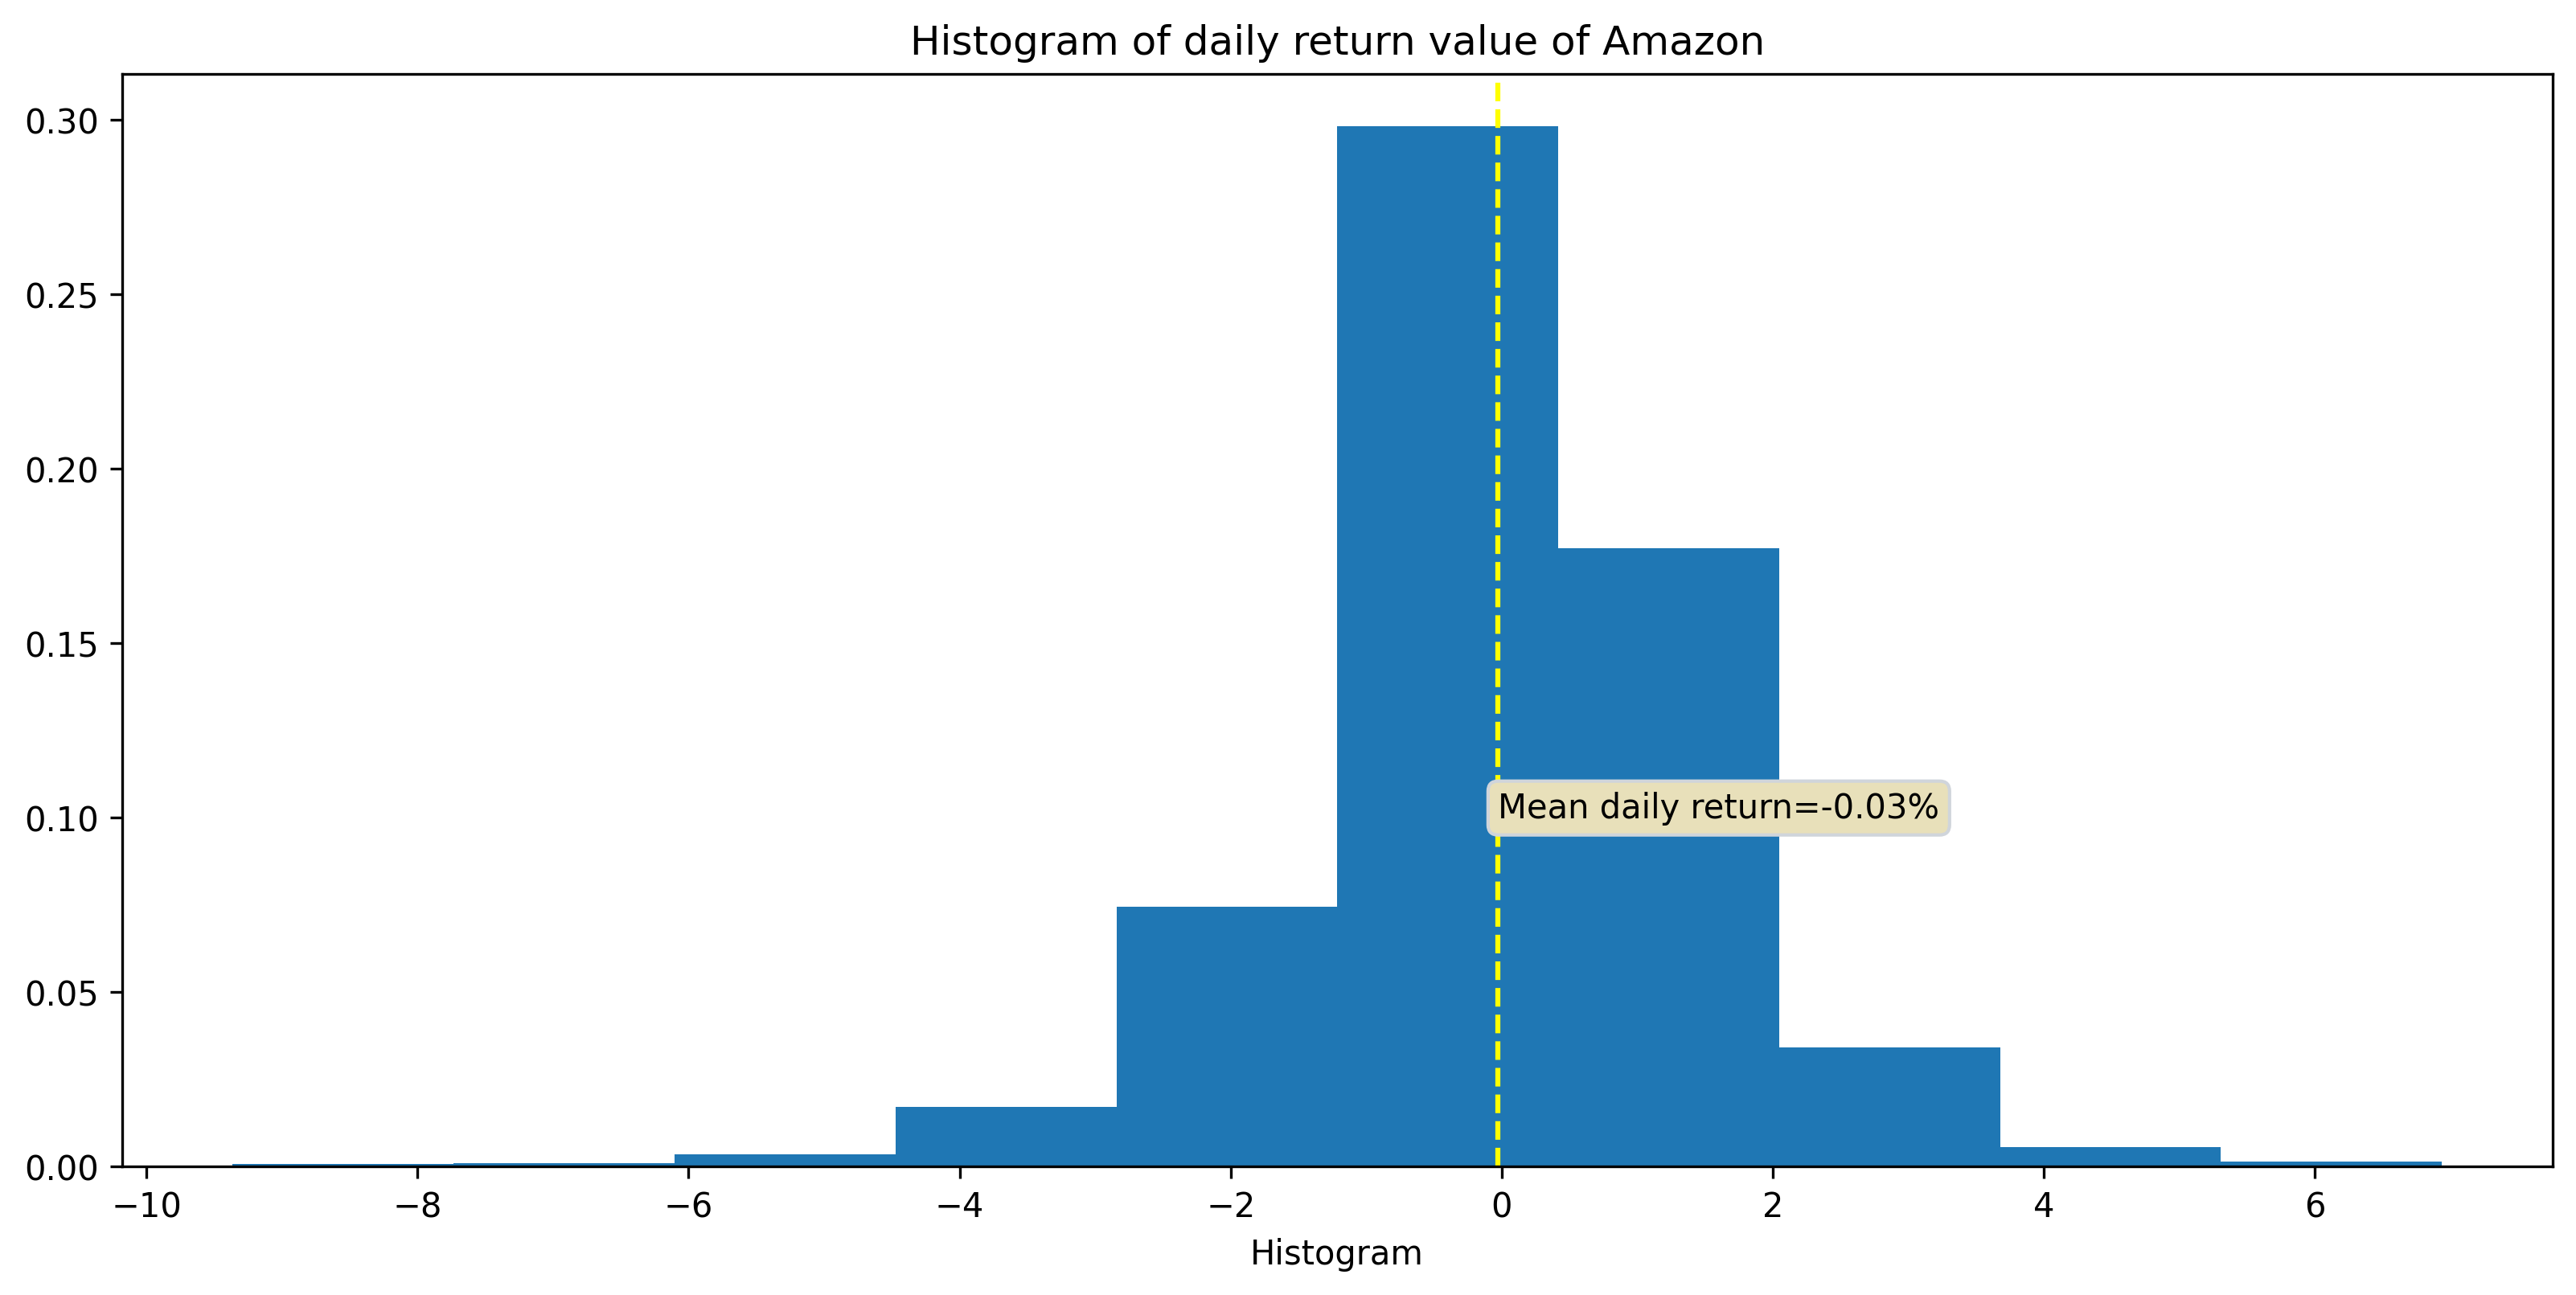
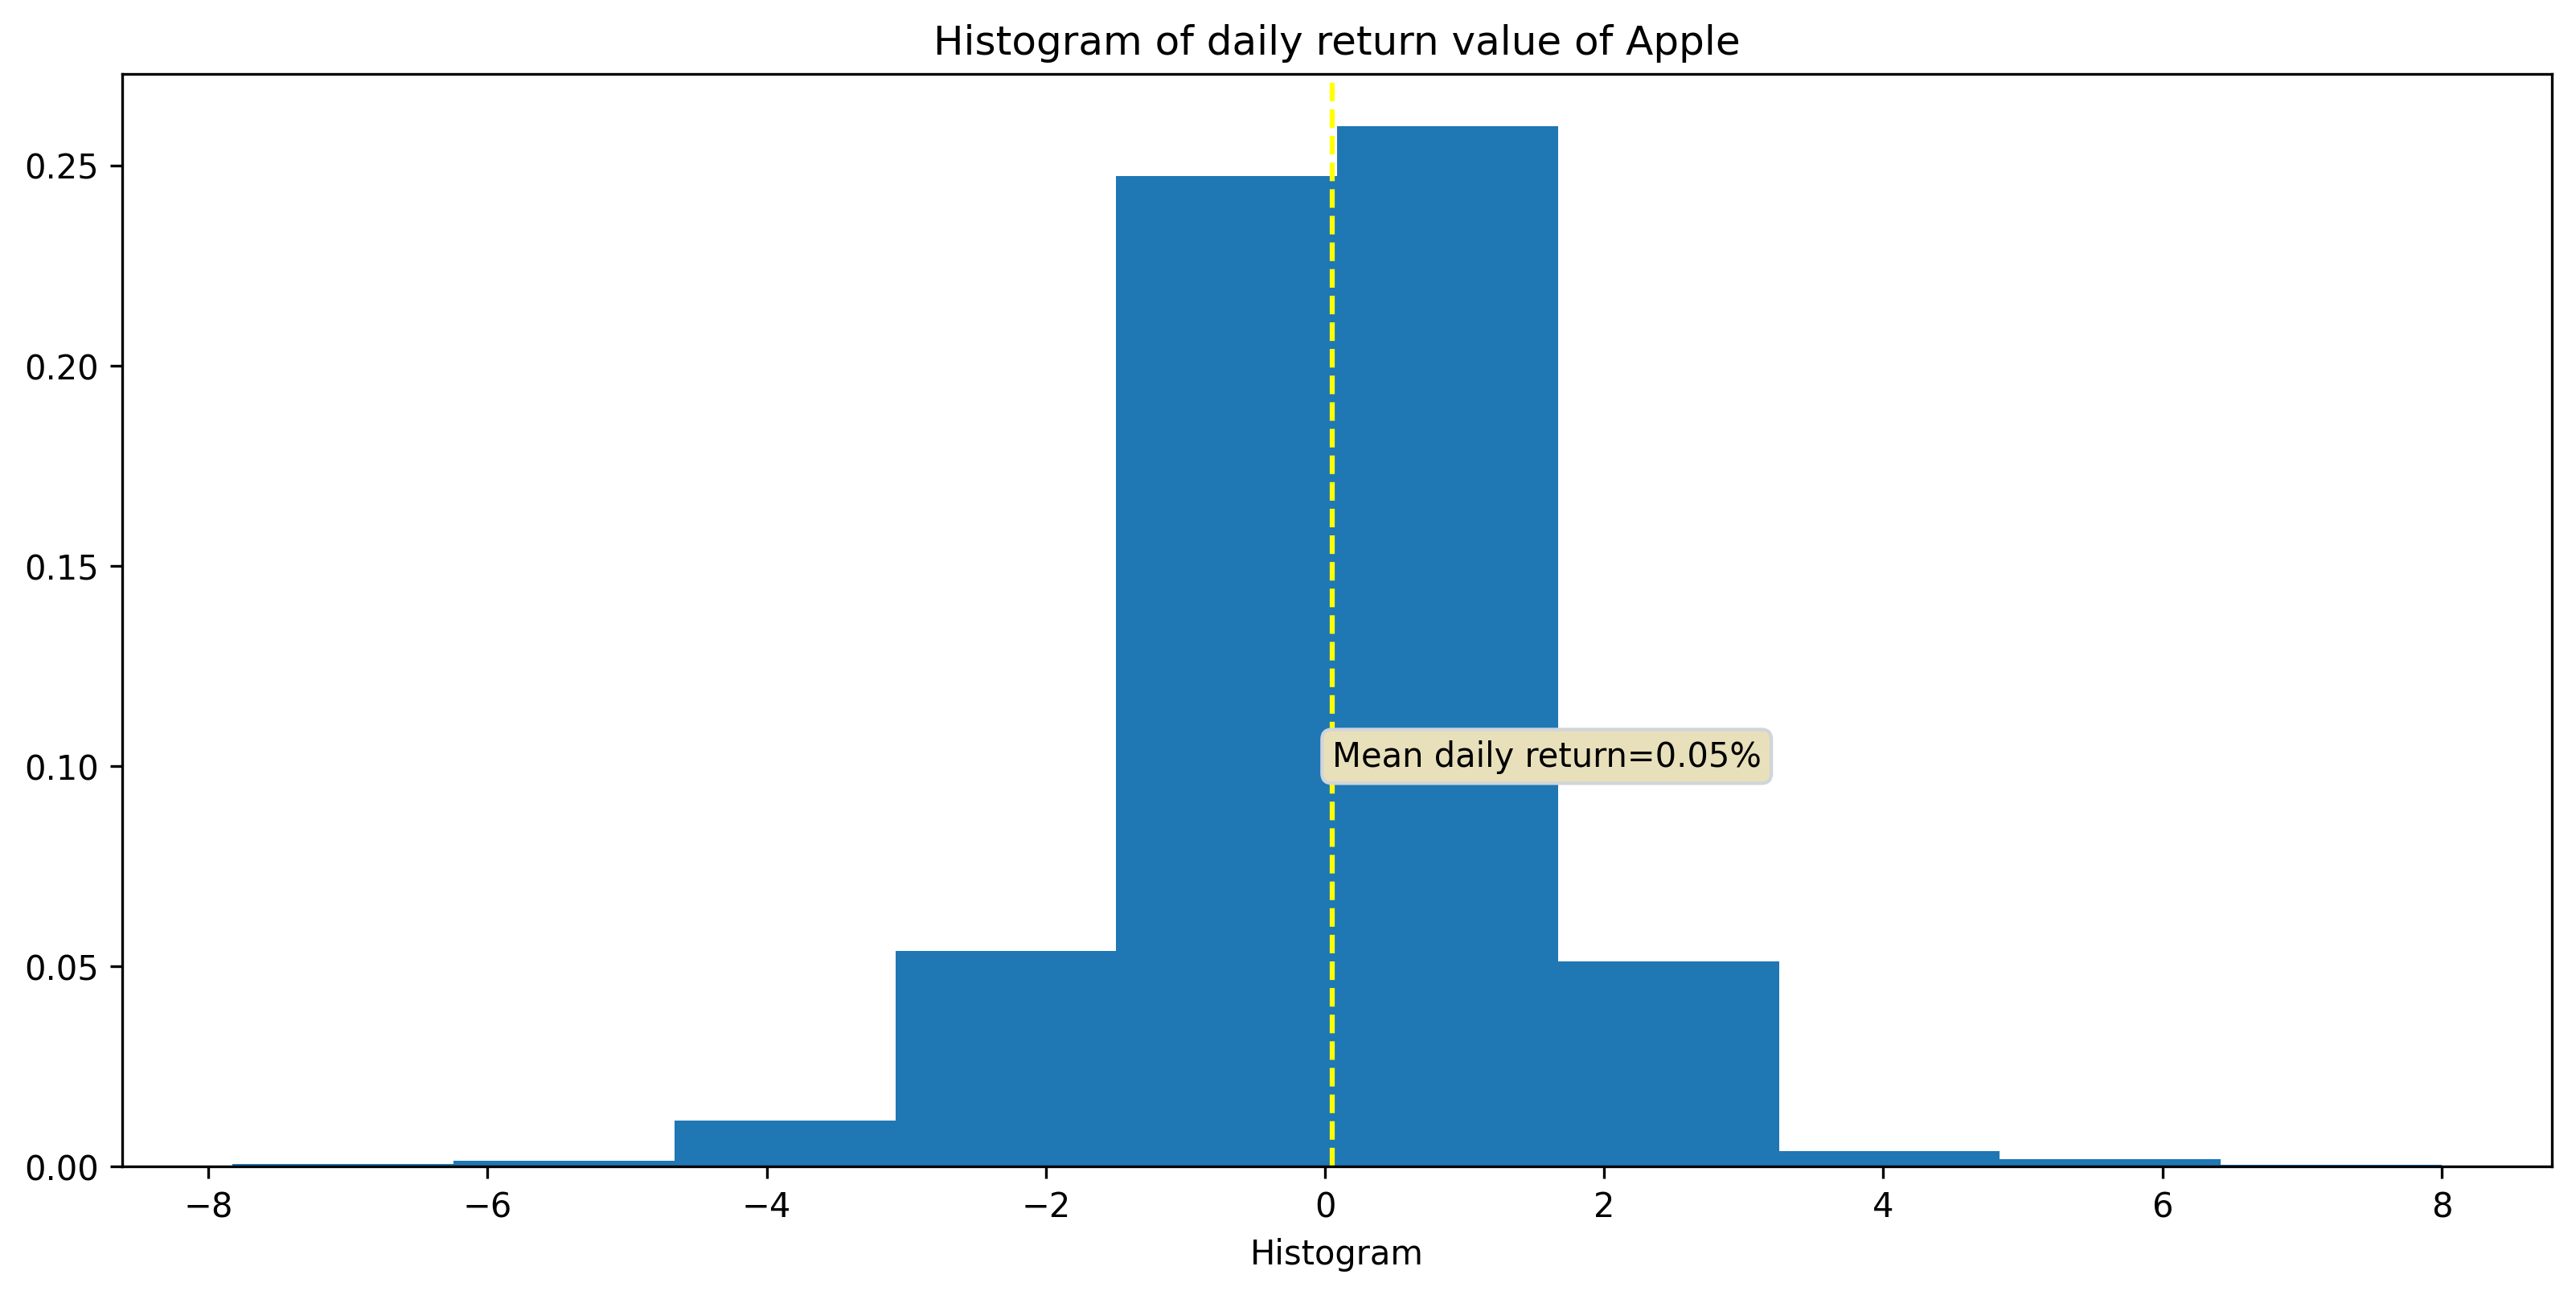
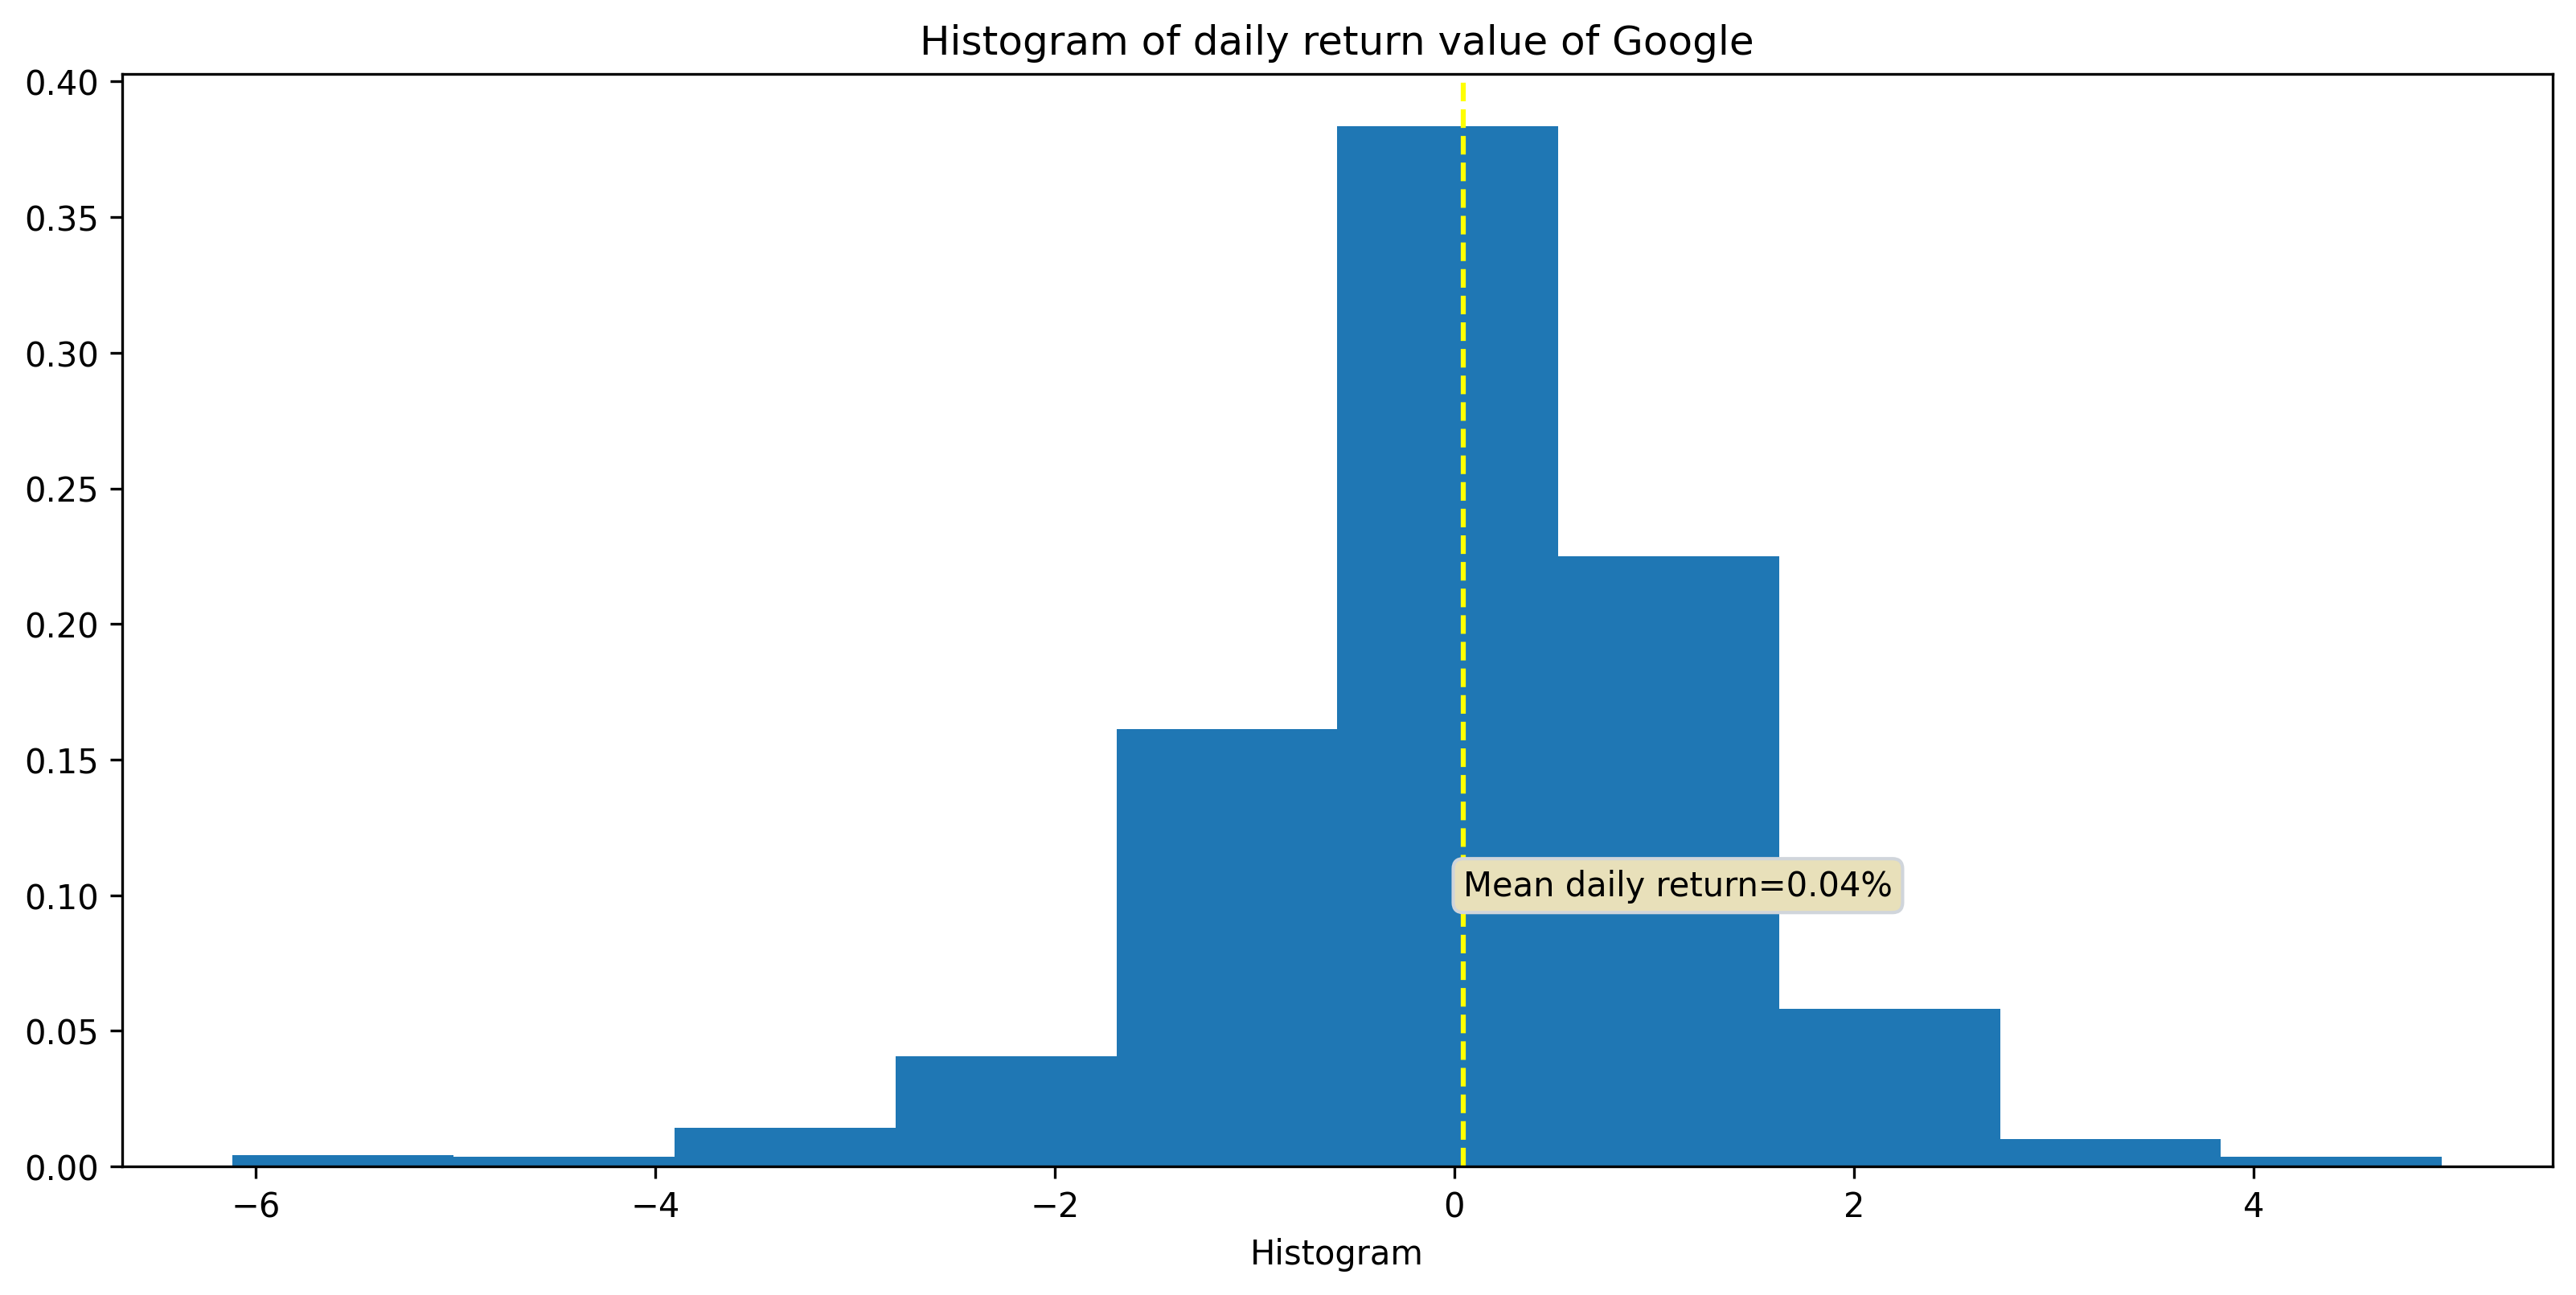
Daily return of any stock price is 0%, I check this by creating a histogram of daily return of stock prices:
Time series analysis and stock price forecasting:
Below I describe the time-series analysis and prediction for the closing stock price of Amazon:
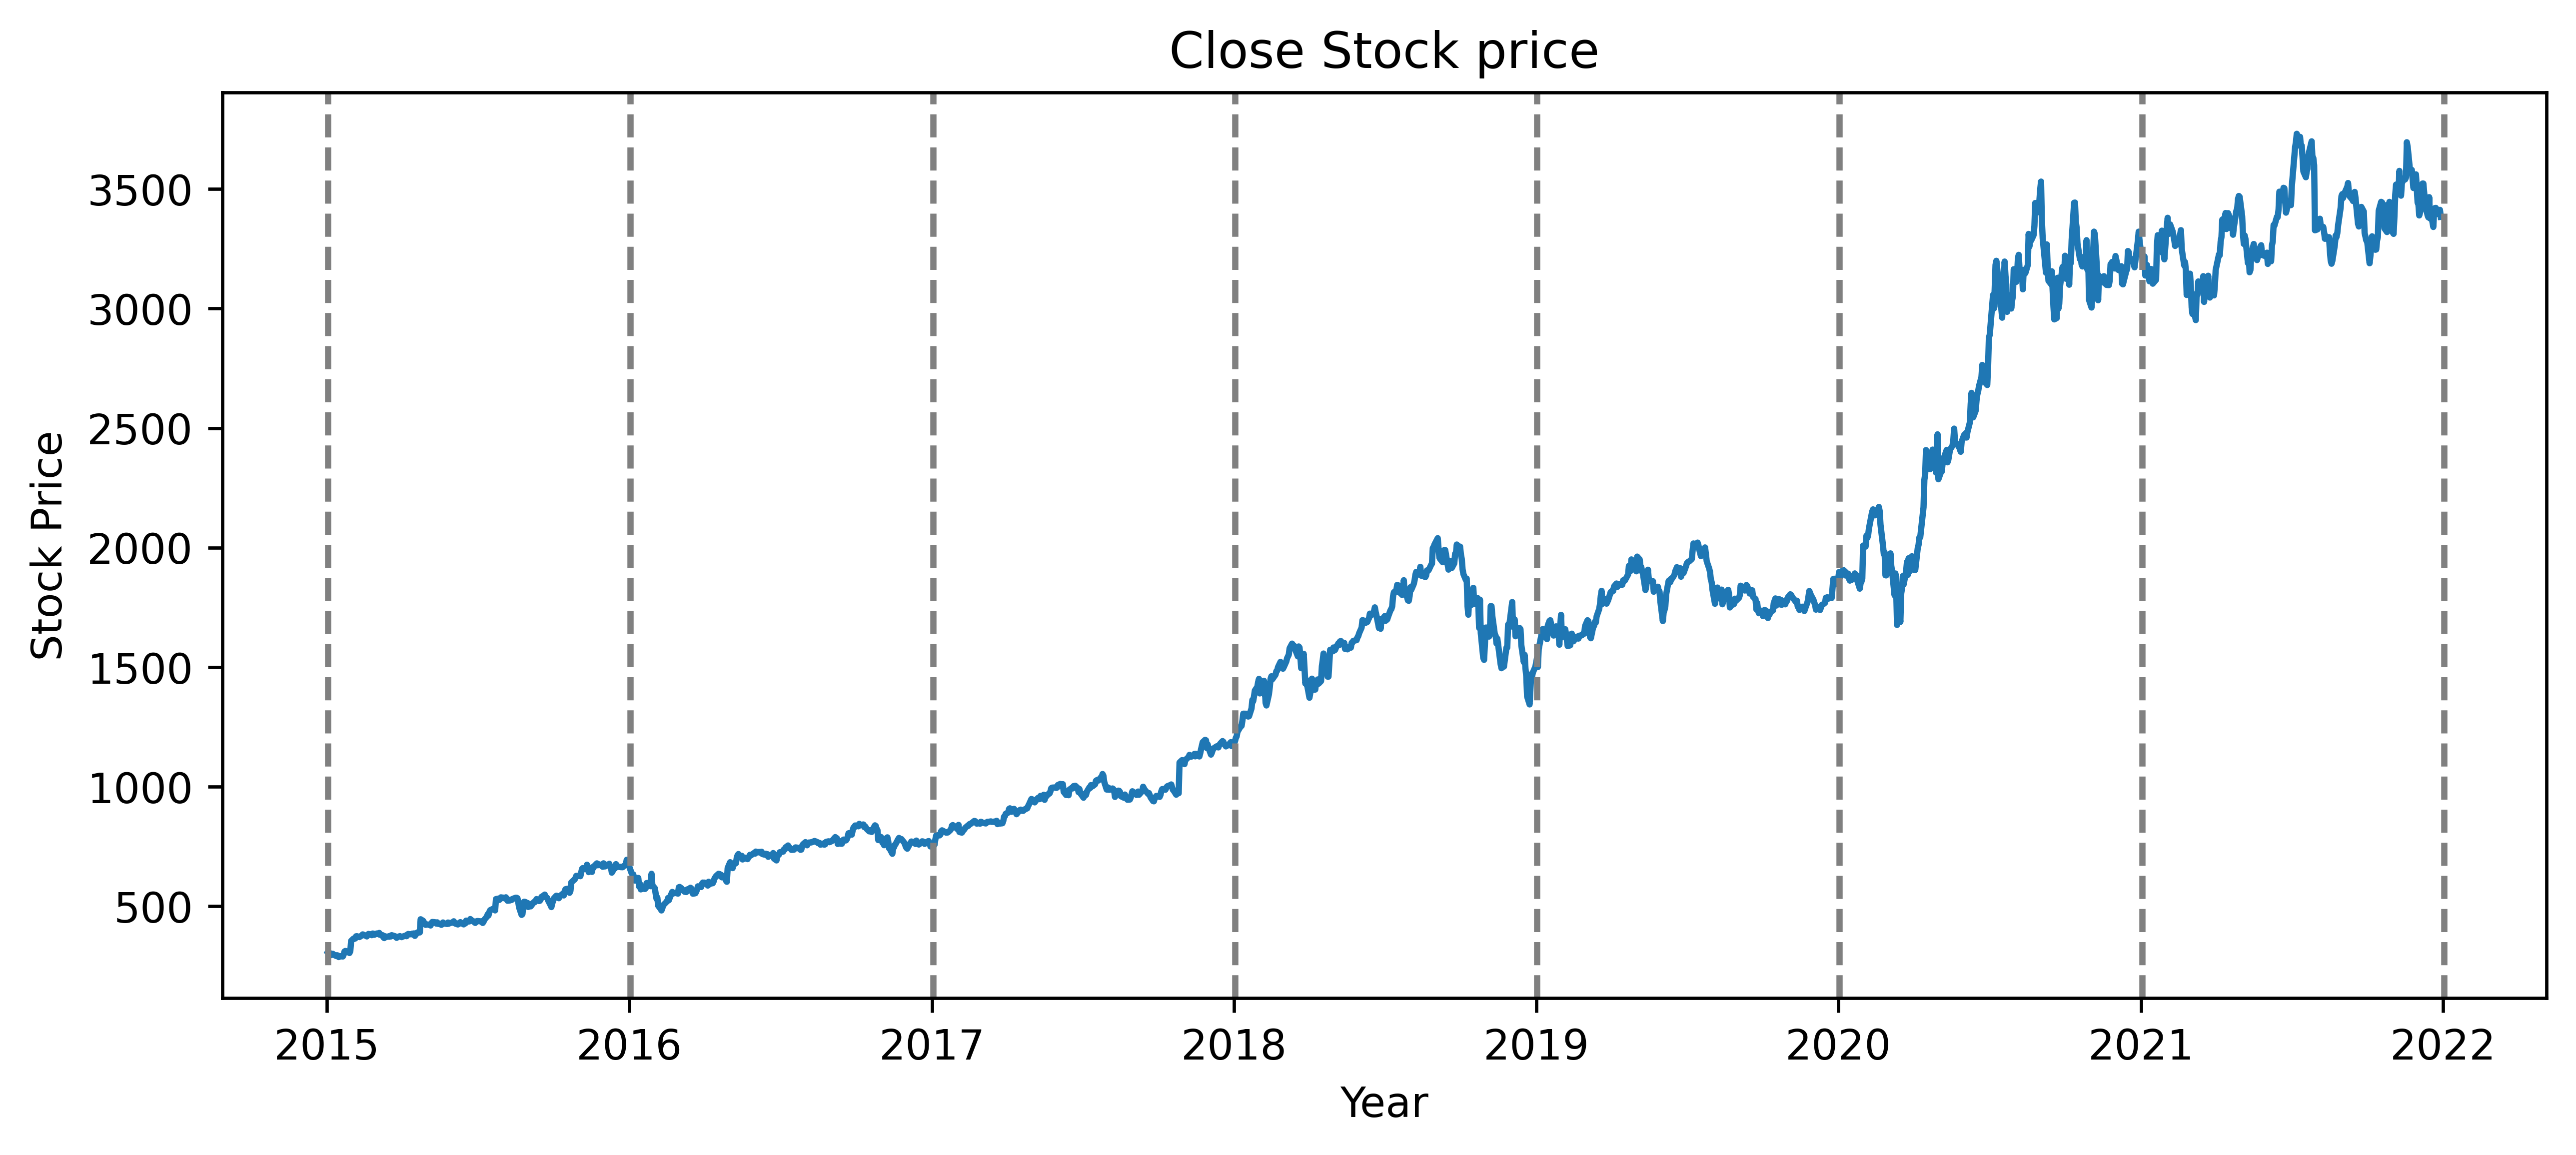
- Visualised and made density plots of stock prices, to see any visual trends
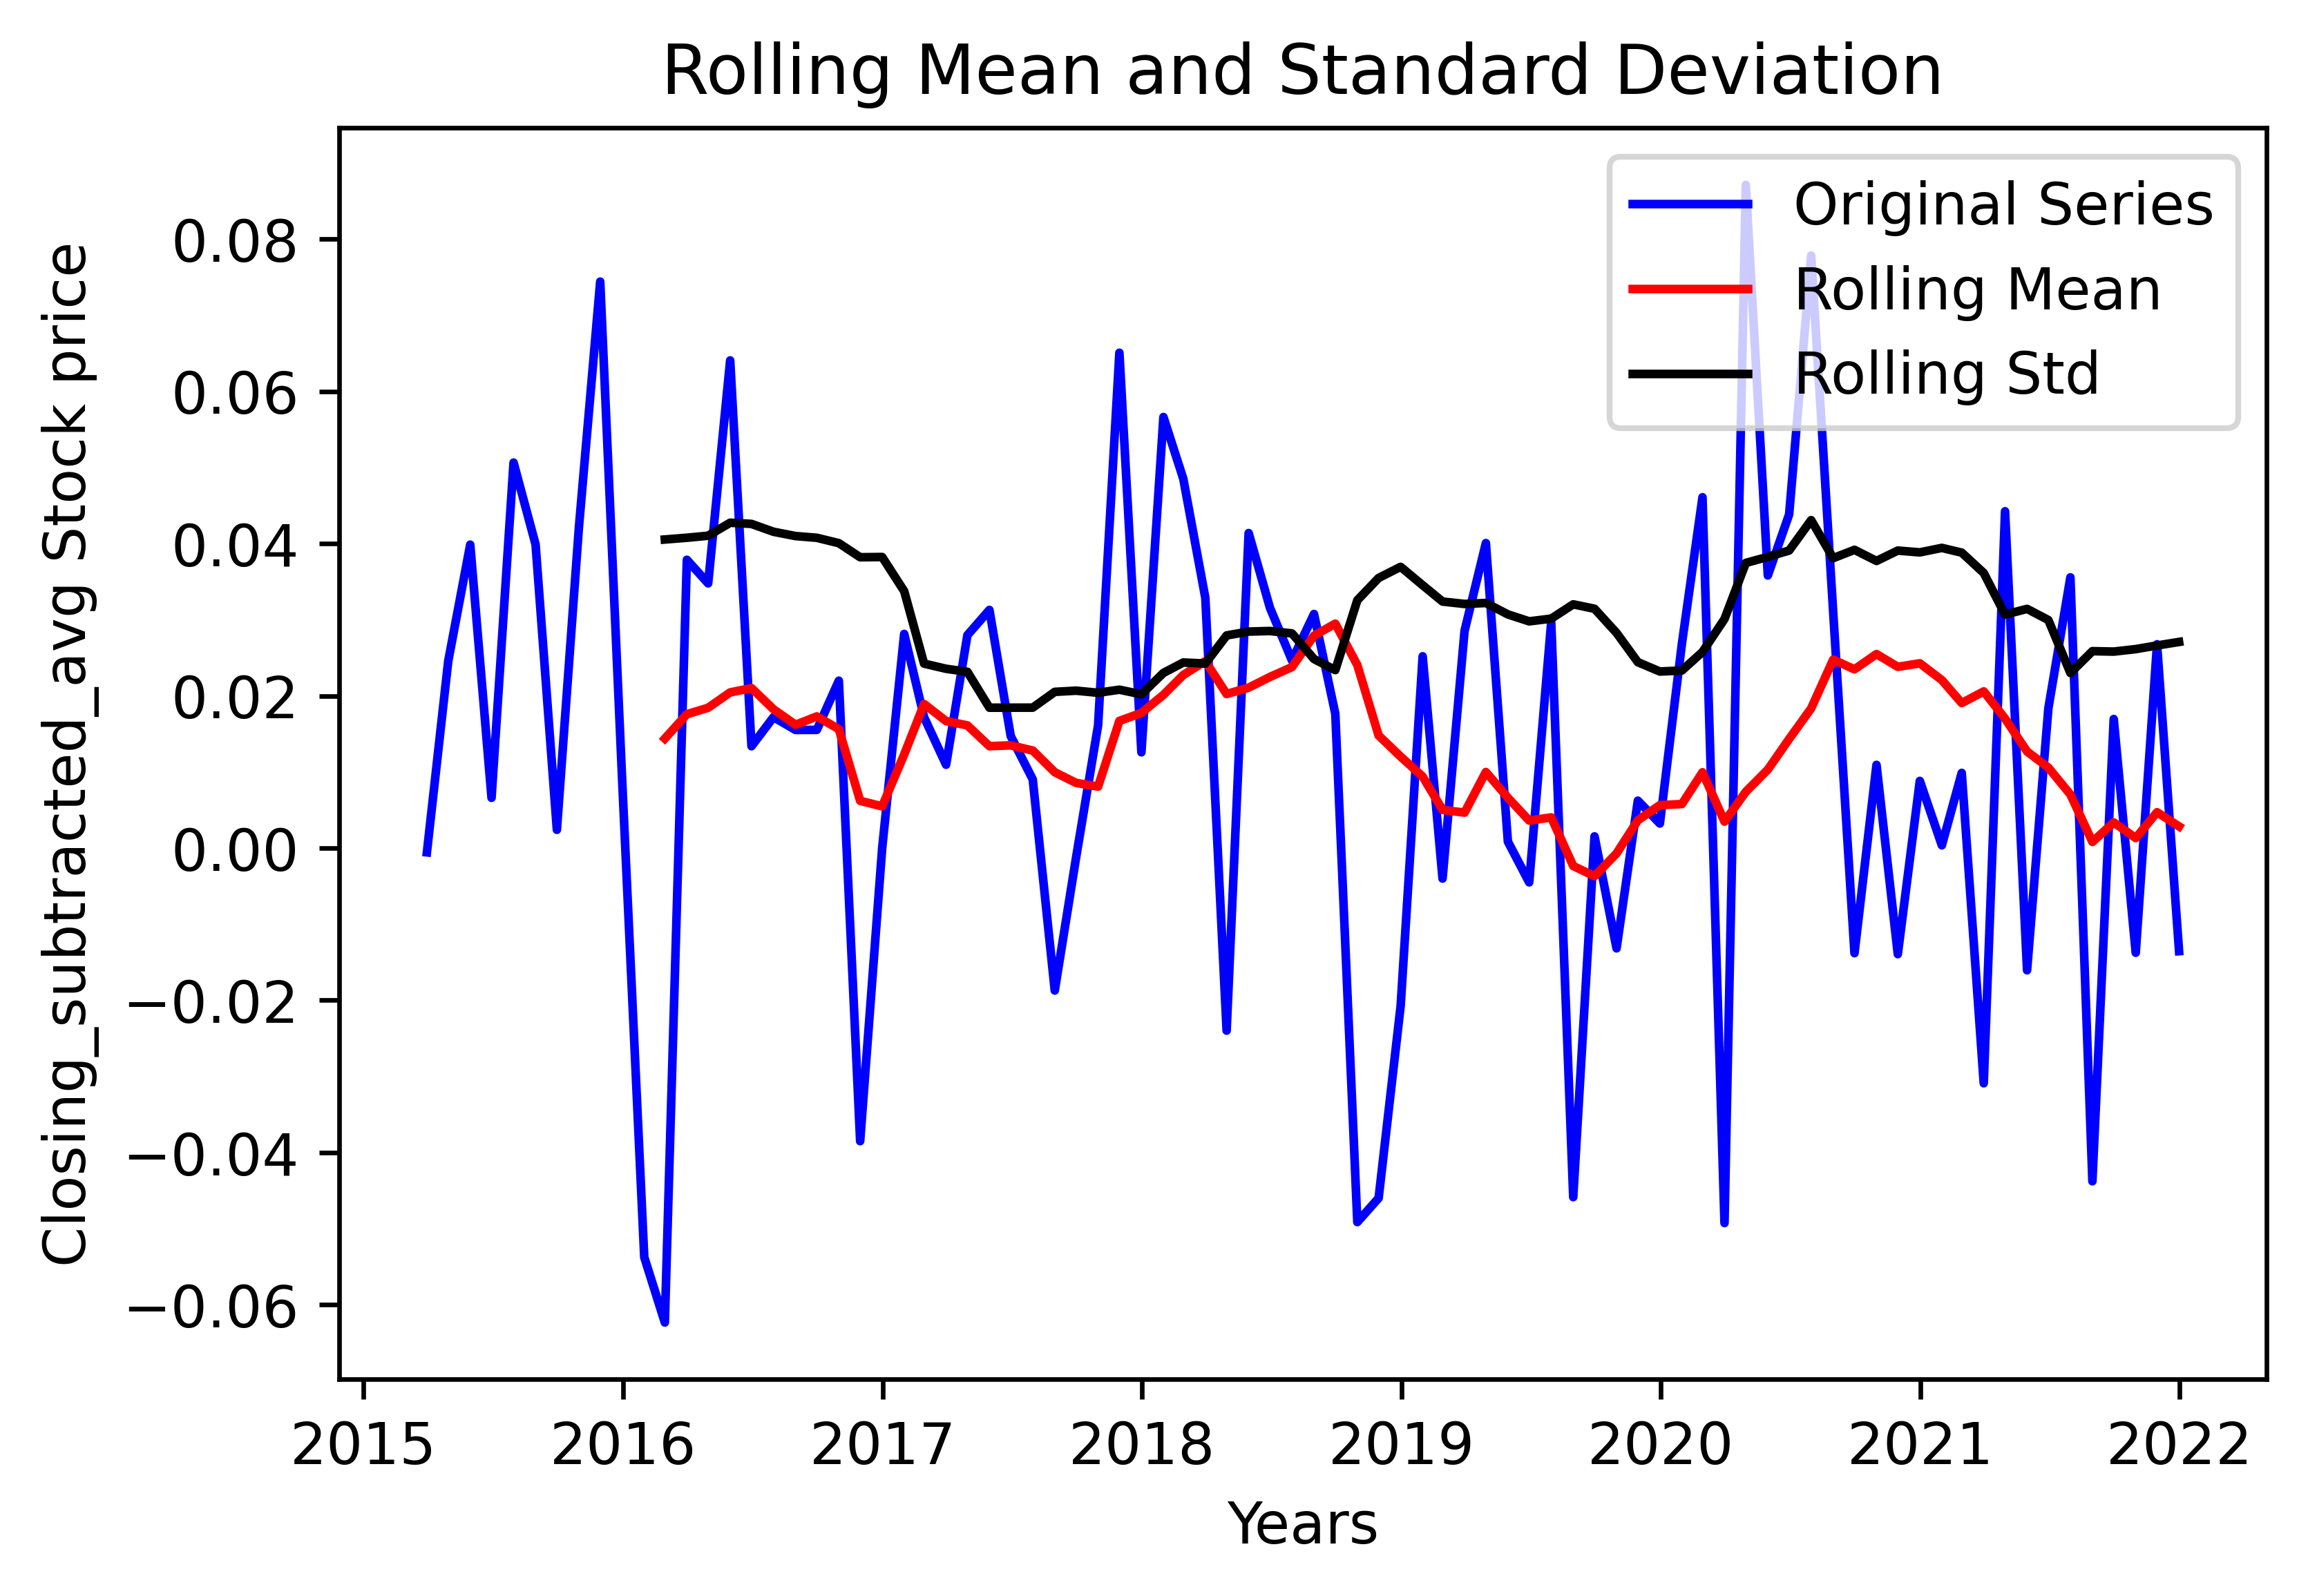
- Observed moving variance and moving mean in the time series
- Confirmed and quantified this result through large p-value from ADF Test
- Checked trends by decomposing the series
- Used two methods to remove trends:
- Took Log of the series to remove varying variance in the series
- Took 1st difference
- Took difference with moving average
- Both resulted in low p-val from Augmented Dickey-Fuller(ADF) Test
- Created correlograms with both time series using ACF and PACF to determine the significant lags
- Time series with Method 1:
- Found Significant lag at 11 months and 16 months in PACF
- Implies AR model can be used to fit the data
- Time series with Method 2:
- Found significant lag at 16 months in PACF
- Implies AR model can be used to fit the data
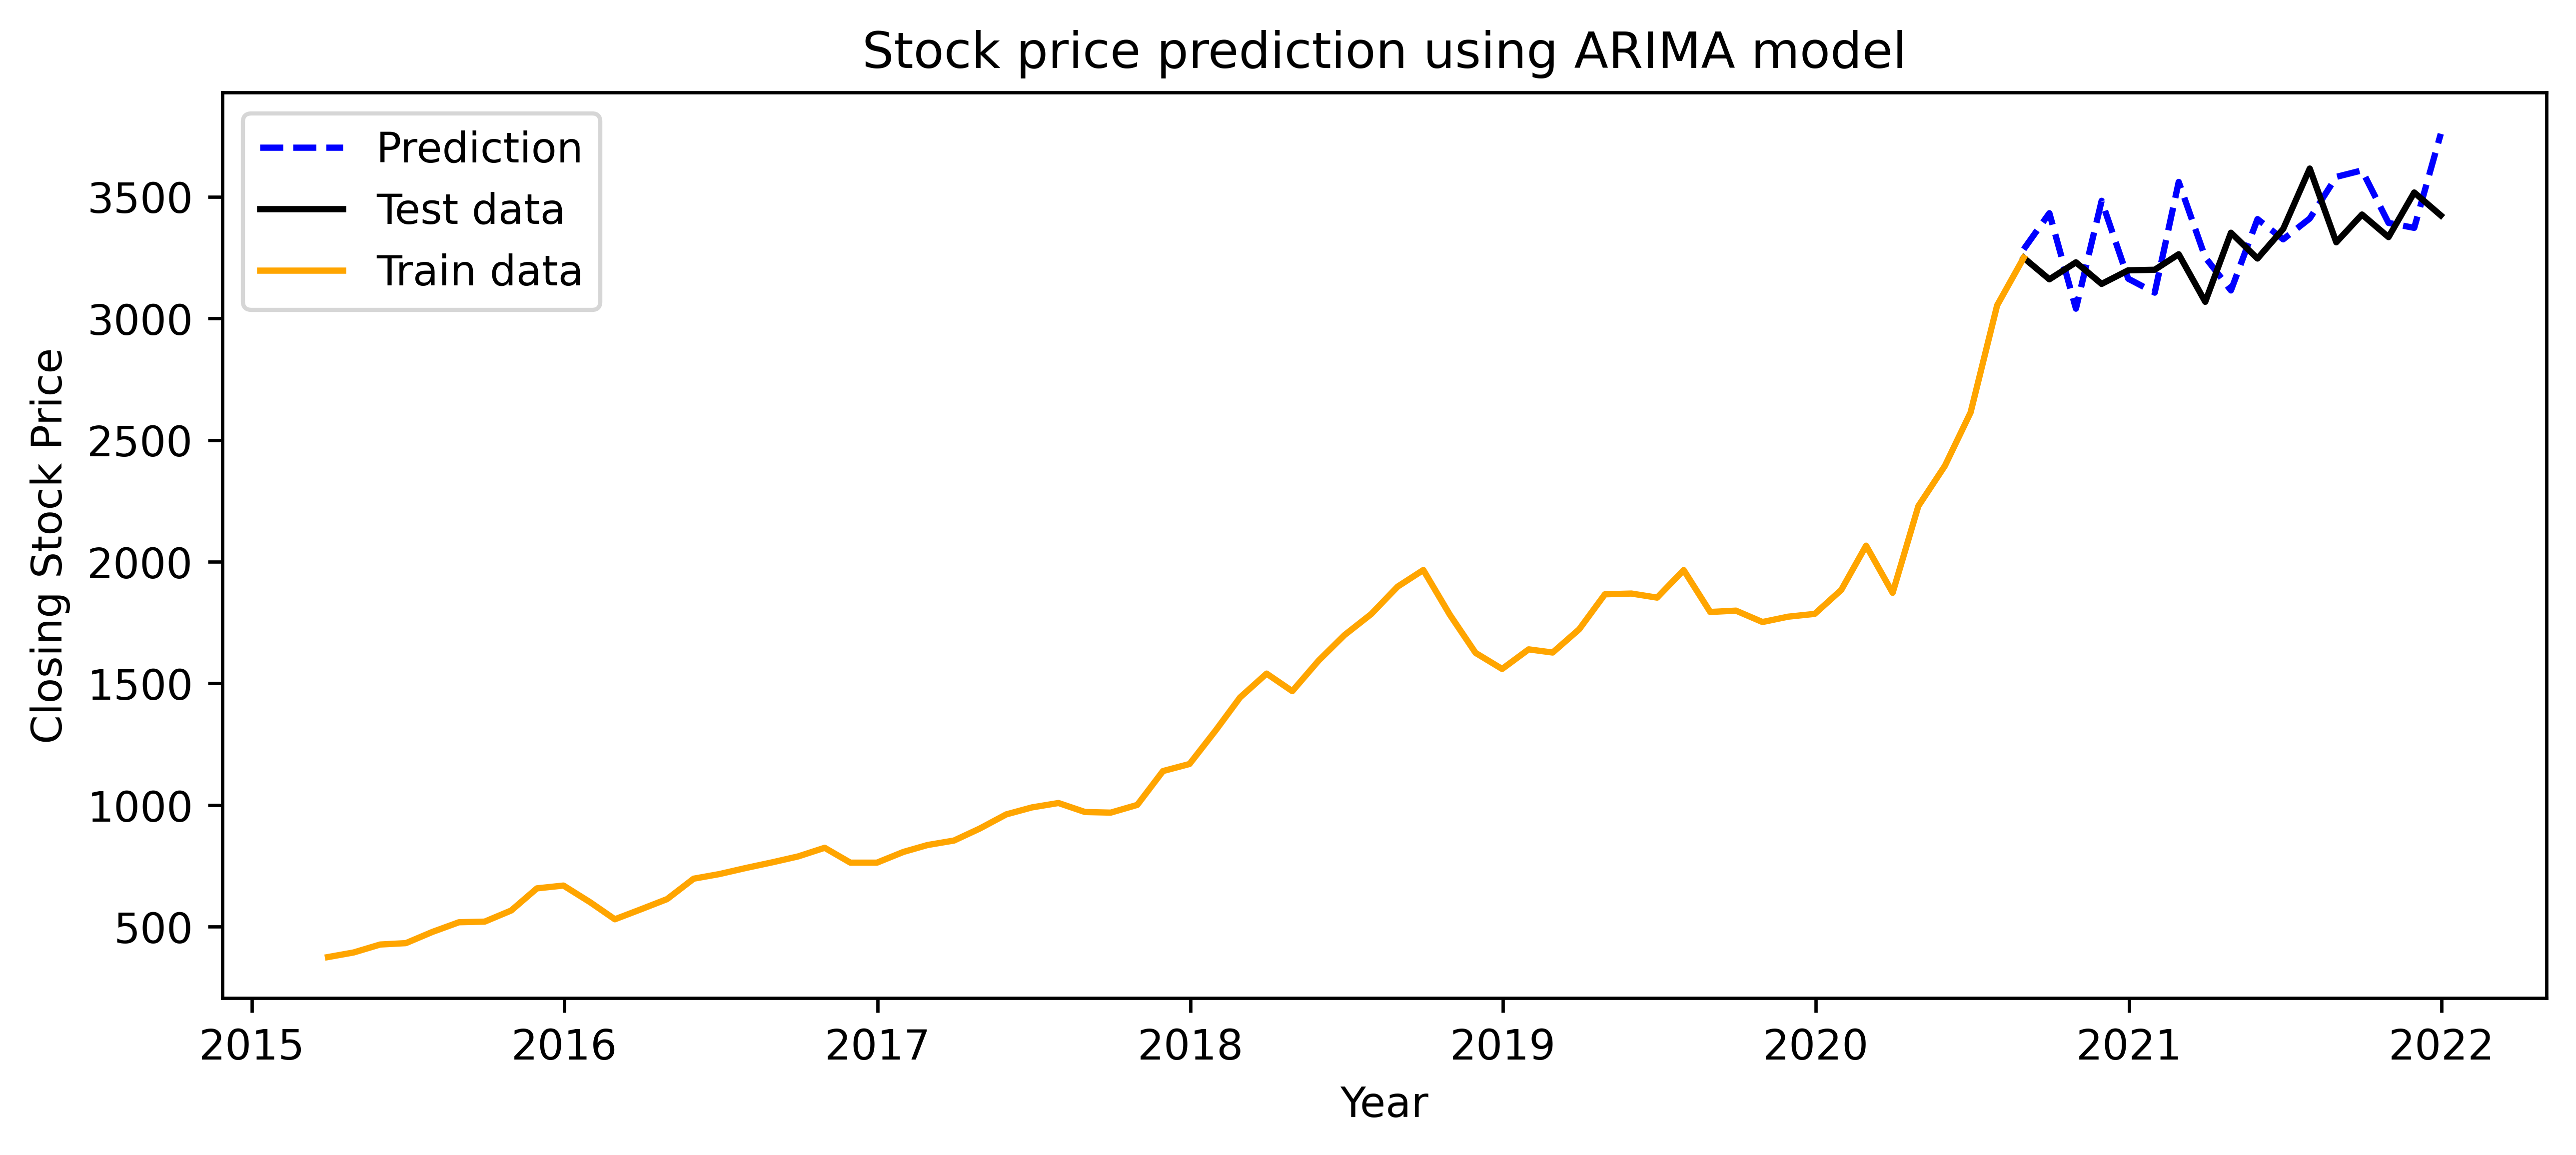
- We will first try to fit the series with ARIMA model
- Proceeded to run ARIMA model with 16 months lag
- Looking at the p-value of each lag, we see LAG of 11 months is the only significant lag for ARIMA model
- I then check the prediction of the model on test data, and plot the residuals obtained between the prediction and test data
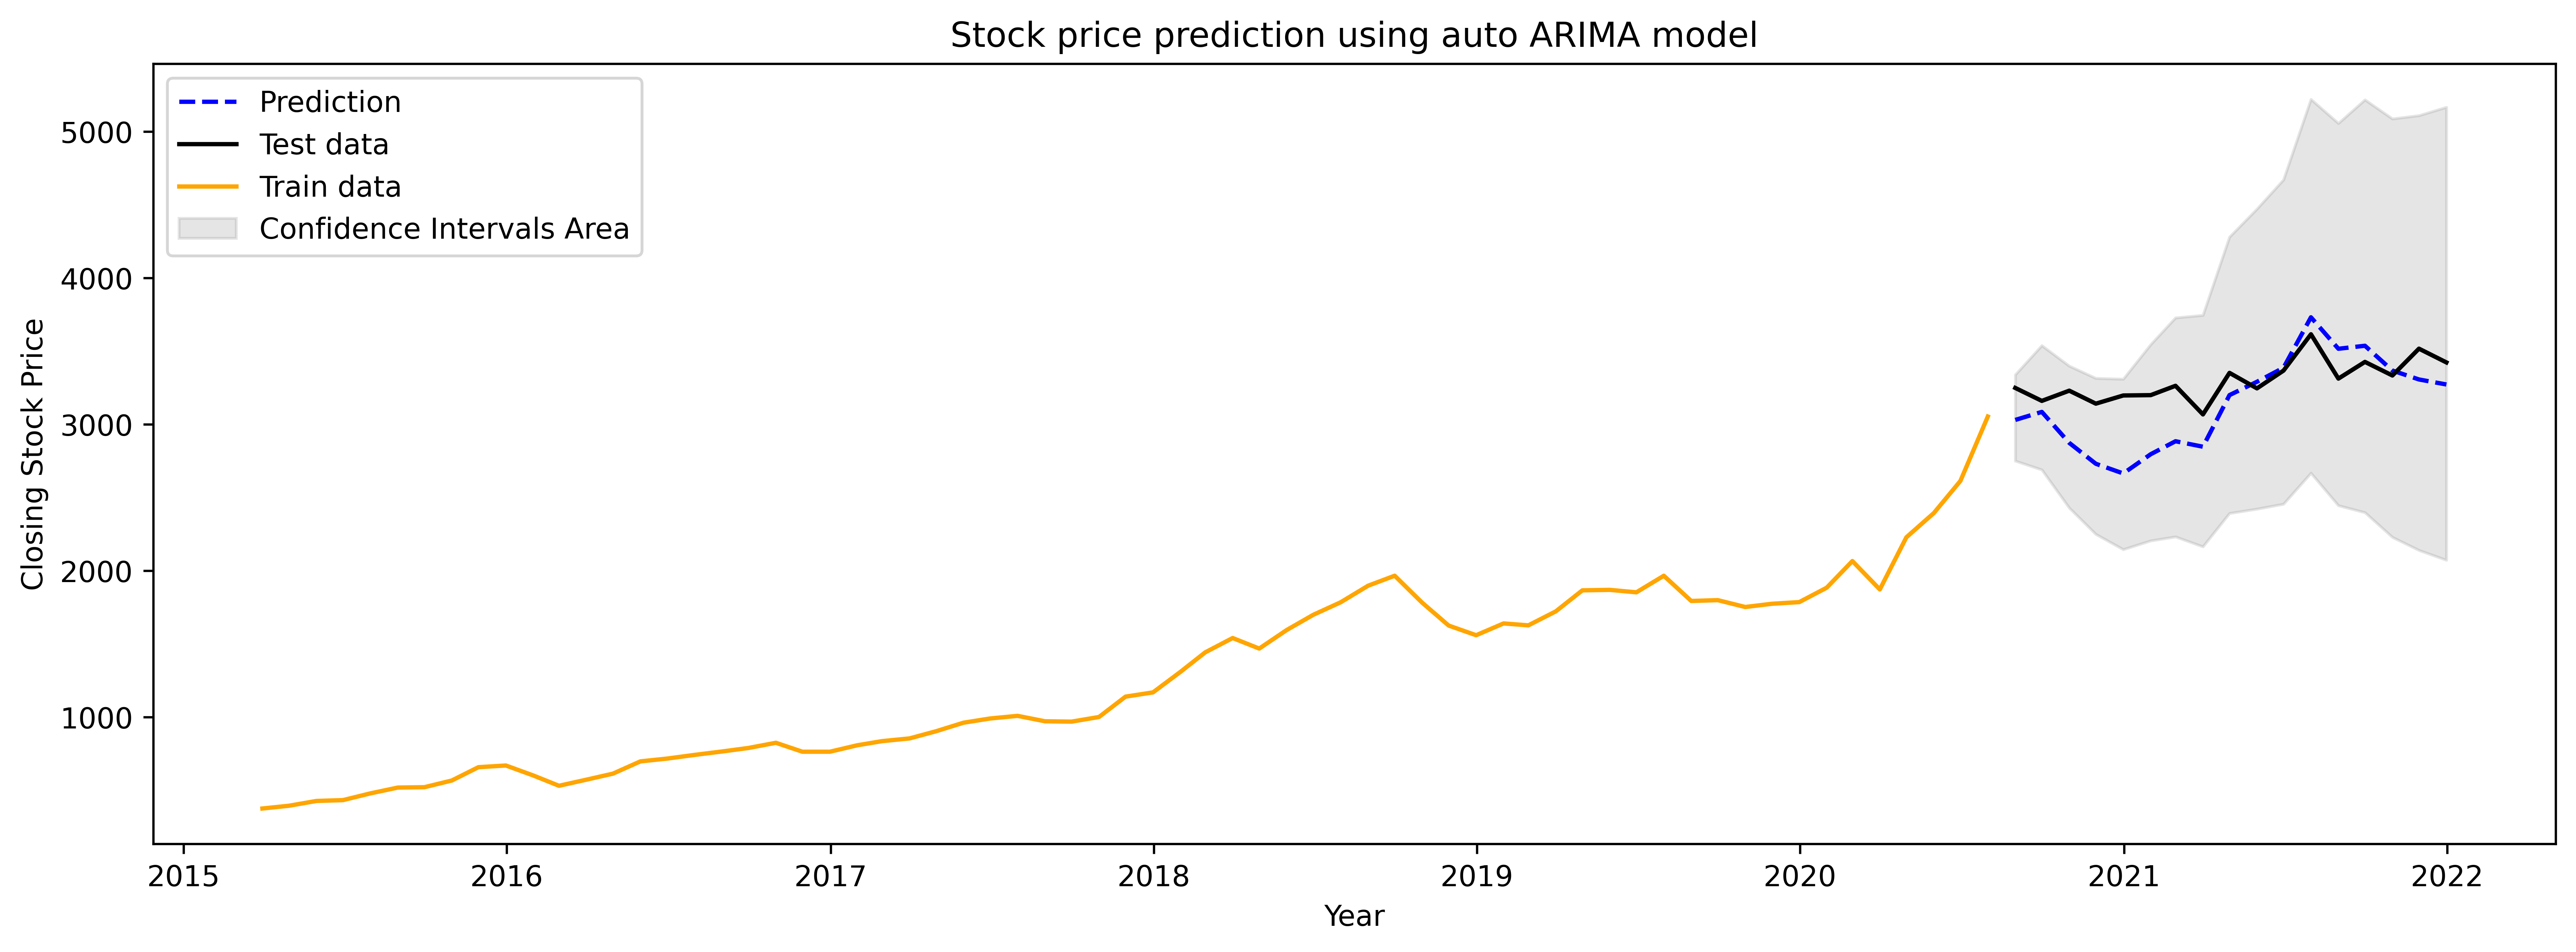
- I then ran auto-ARIMA model to check the results from the optimum number of lags
- Optimum model found is : (0,1,0)(1,1,0,12) ==> Seasonal Differencing is found in the time series
- Plotted prediction on test data
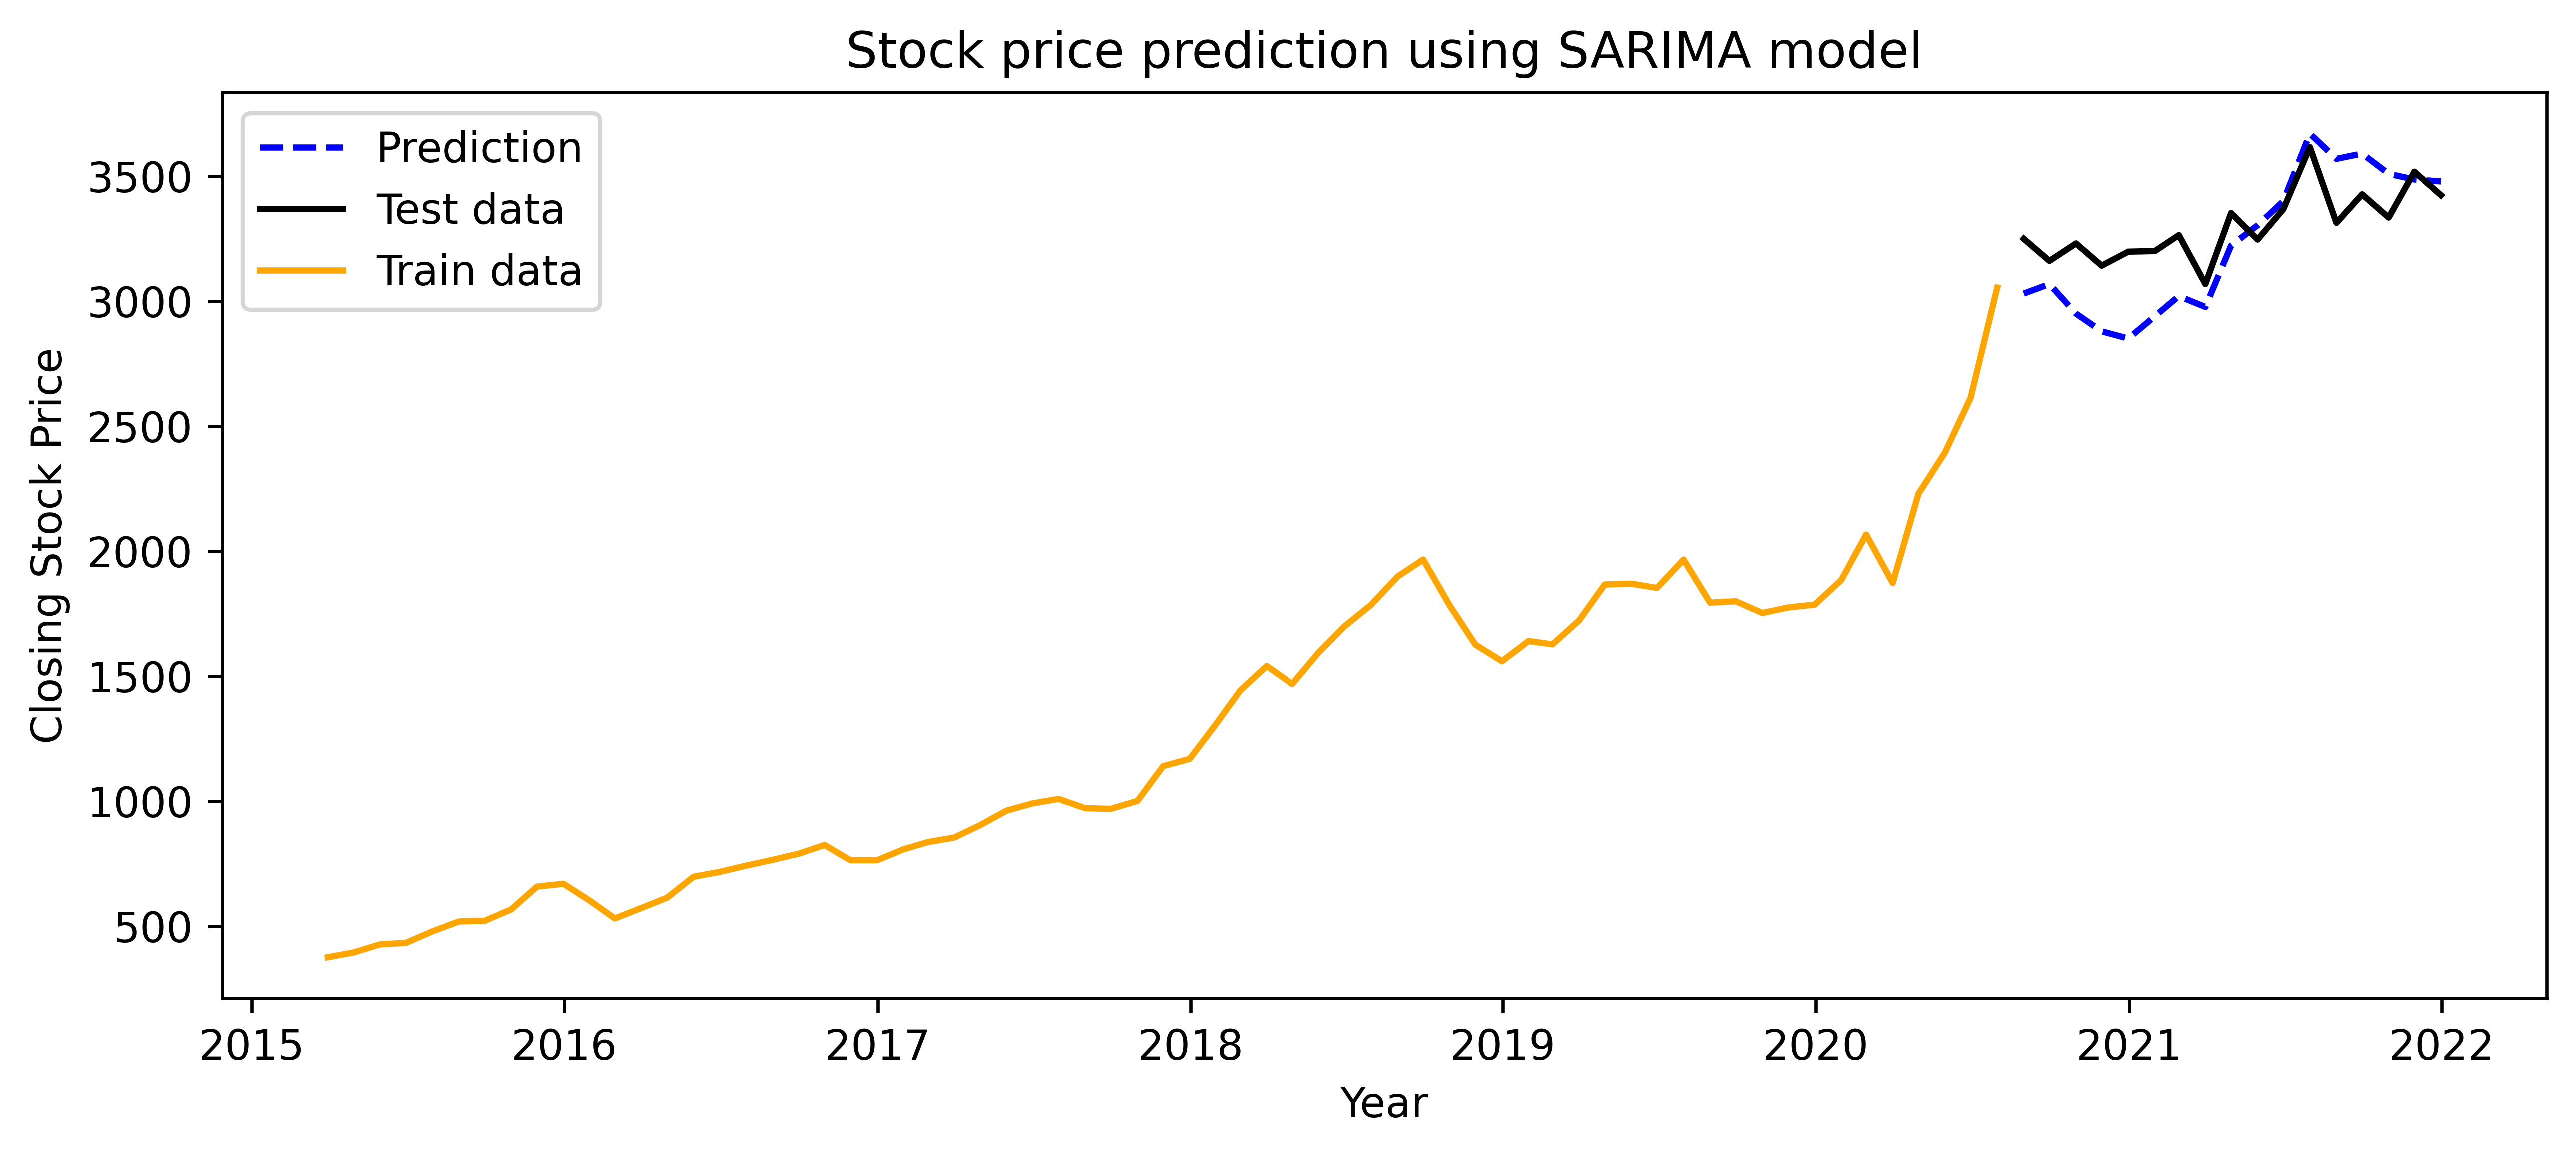
- Also performed training with SARIMA model
- Determined forecast with 90% Confidence by training on all the data
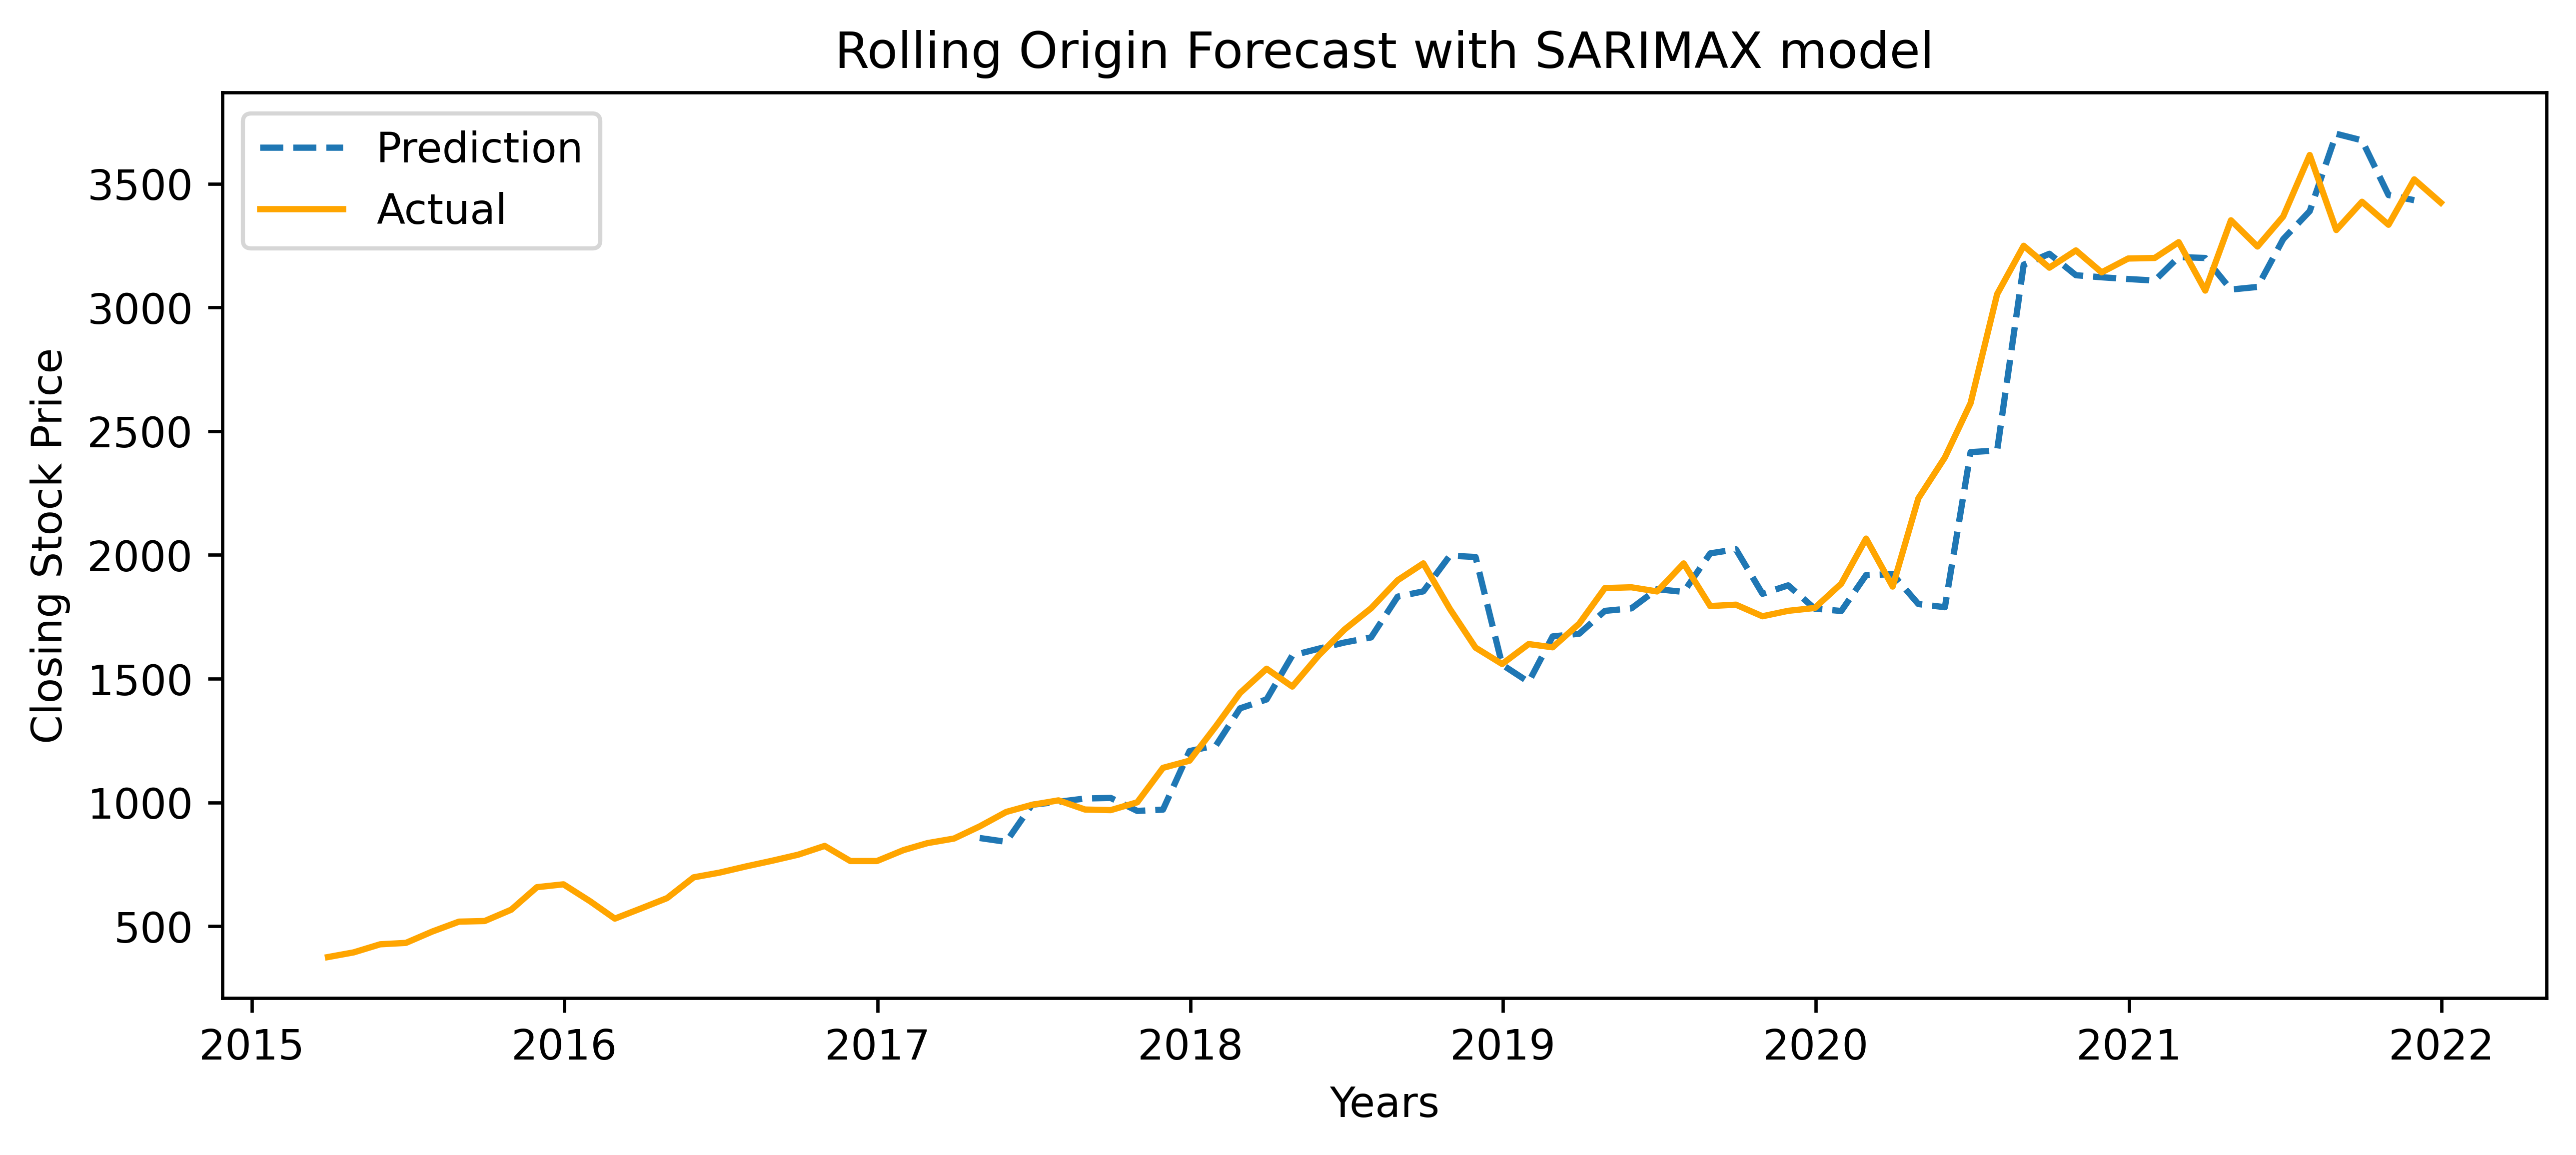
- Predicted rolling origin forecast and 1 year of forecast in future with 90% Confidence interval
Residual plot from ADF test:
Fitting PROPHET time-series model to the data-set:
"Prophet is a procedure for forecasting time series data based on an additive model where non-linear trends are fit with yearly, weekly, and daily seasonality, plus holiday effects. It works best with time series that have strong seasonal effects and several seasons of historical data."
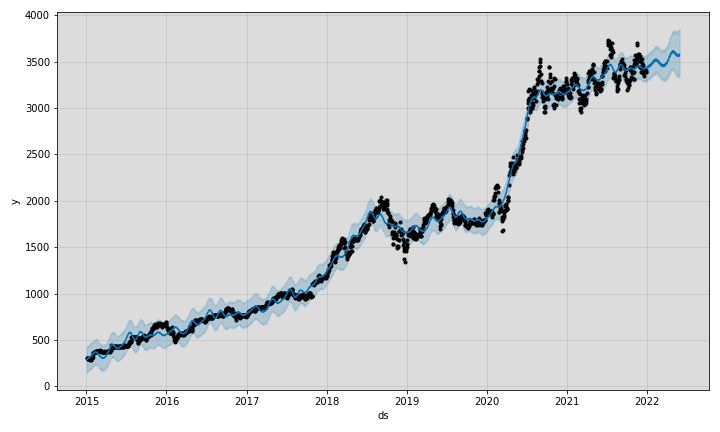
Stock price forecast using Prophet model.
I finally calculated Normalised Root-Mean-Squared (NRMSE) value for each model's prediction on the test dataset. Both Prophet and Auto-Arima models performed good in fitting for seasonality and trends in the data-set.